
Figure 3.
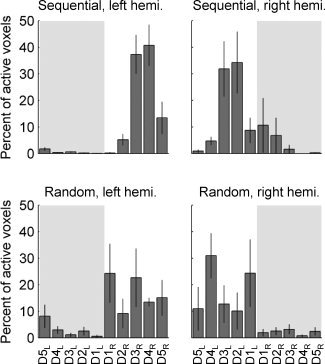
Experiment 1: Distribution of activated voxels within the entire area of interest. Sequential (top) and random (bottom) order task, left hemisphere (left column) and right hemisphere (right column). The histogram represents the percent of all active voxels assigned to each digit (mean ± SE, n = 4 subjects). In the random‐order task, both hemispheres demonstrate more even distribution of voxels assigned to digits of the contralateral hand. Shaded background indicates response from digits ipsilateral to the labeled hemisphere.