
Figure 6.
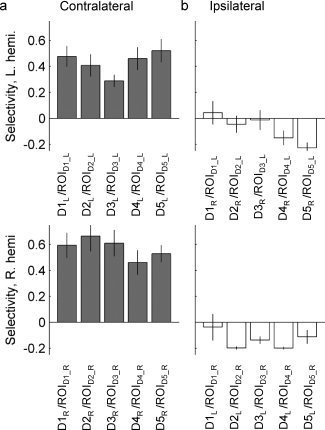
Experiment 2: Selectivity indices for BOLD responses. (a) Top row: selectivity index (SI) for right digits in left hemisphere ROIs; bottom row: SI for left digits in right hemisphere ROIs. X‐axis label indicates the cued digit (numerator of the SI) and the ROI for which the SI was calculated (denominator is the sum of all positive BOLD responses to motion of digits of the same hand). (b) SI for ipsilateraldigits. In this calculation the numerator is the BOLD response during ipsilateral digit cueing in the ROI defined by the opposite finger. For example, in the first column the SI for D1L movement relative to other left digit movments is shown within ROID1R. These data demonstrate negative BOLD responses that do not strongly depend on cued digit movement.