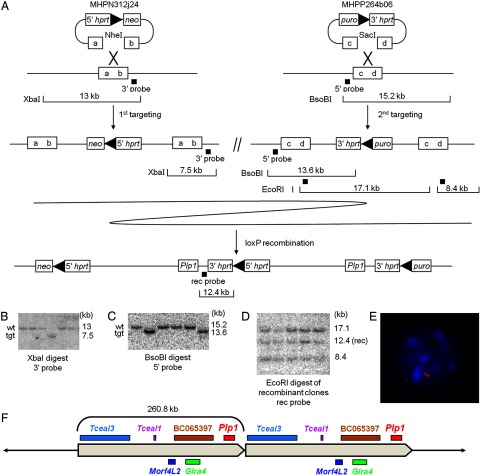
Figure 1.
Plp1dup mice were generated by chromosome engineering. A, Strategy for generating Plp1dup mice using two targeting steps and a loxP recombination step. MHPN312j24 and MHPP264b06 are the mouse engineering vectors inserted in the first and second targeting steps at the ends of the region to be duplicated. Boxes with “a–d” represent targeted regions of the genome that were digested in the vectors by NheI and SacI restriction enzymes, respectively. The locations of probes used to check ES cell DNA by Southern blot hybridization after each step are indicated by black squares and restriction fragments analyzed are shown for each step. Representative Southern blot analysis of ES cells after (B) the first engineering step showing one recombinant clone, (C) the second engineering step showing two recombinant clones, and (D) the loxP recombination step showing all recombinant clones. E, Representative interphase nucleus from FISH analysis of blood lymphocytes from a male Plp1dup mouse. The Plp1-containing fosmid probe (red) hybridized to two regions and the control probe that is outside of the duplicated region (green) hybridized to one region. Scores are as follows: Male Plp1dup mouse (n = 100), 24% of nuclei had one red spot, 69% had two, 7% had three or more; normal male mouse (n = 100), 81% of nuclei had one red spot, 15% had two, 4% had 3 or more. Only nuclei with one green spot were scored. F, Diagram of the 260.8 kb duplication in Plp1dup mice showing relative locations and approximate sizes of the genes within the duplicated region in the Plp1dup mouse model. Those genes shown on top are transcribed from centromere to telomere; those on bottom from telomere to centromere. tgt, Targeted genotype.

