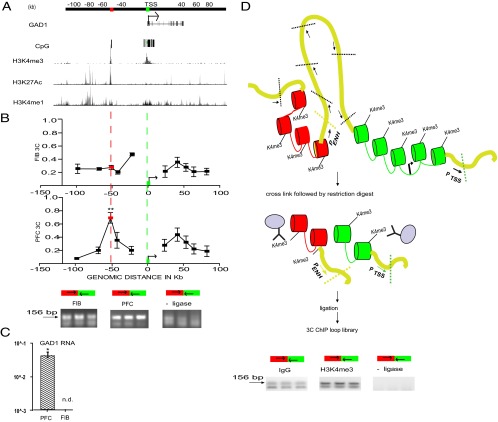
Figure 1.
Chromosome 2q31 conformation at the GAD1 locus. A, Genome map for 200 kb surrounding GAD1 TSS, including 50 kb GAD1 gene body and surrounding sequences as indicated. Browser tracks showing H3K4me3 landscape at 2q31 in PFC neurons, and H3K27ac and H3K4me1 (composite ChIP-seq tracks from 3 ENCODE cell lines). Red and green boxes represent two HindIII restriction fragments that harbor sharp H3K4me3 peaks in PFC neurons. B, x-y graphs present chromosome conformation capture (3C) profiles across the 200 kb portion of chromosome 2q31 for (top) skin fibroblasts, FIB (N = 2 donors) and (bottom) prefrontal cortex, PFC (N = 4 donors) as indicated. Each data point expresses the interaction frequency between a specific restriction fragment with the TSS. Data are mean ± SD. 3C maps were anchored on TSS containing fragment (green). There is significant interaction (one-way ANOVA, **p < 0.001 Bonferroni corrected) between two CpG-rich, H3K4me3 decorated sequences in the PFC (A, red and green boxes; and referred to as GAD1-TSS-50kbLoop in the text). Representative gel images for PCR products from 3C assays, showing a specific interaction between red- and green-marked HindIII fragment as indicated (green box represents primer 5′-GGGCGGGAAAGGTGCATAAAACTGAGACTGA, hg19 chromosome 2: 171675735–171675765; red box, primer 5′-GTCCTTCAAAACACGTTGCCTAGCAACAAA, hg19 chromosome 2: 171626697–171626726). C, Robust expression of GAD1 RNA in PFC but not in FIB (N = 3/tissue, mean ± SEM, *p < 0.05, Wilcoxon signed-rank test), as determined by qRT-PCR after normalization to 18s rRNA. D, Top, Workflow and results of 3C-ChIP looP experiments. Schematic illustration of 3D chromatin structures at GAD1 locus, including physical proximity between GAD1 TSS sequences (green) and putative enhancer (red) as described in A, B. Chromatin is formaldehyde-crosslinked, followed by HindIII restriction digest, anti-H3K4me3 immunoprecipitation, and religation and 3C PCR to map noncontiguous DNA elements. There is robust PCR-based amplification of noncontiguous DNA sequences from green- and red-marked sequences (GAD1-TSS-50kbLoop) but only weak or nondetectable PCR signal in controls (IgG pulldown with ligase and H3K4me3 pulldown without ligase treatment).

