
Figure 4.
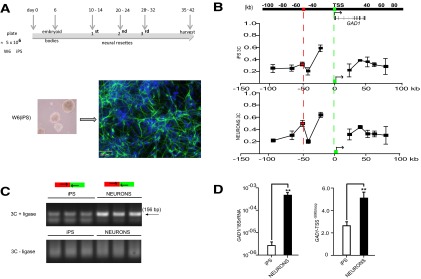
Developmental changes in GAD1 gene expression and chromatin architectures. A, Time line for generating of 1.5 × 10⁷ differentiated cells, including a significant portion of microtubule-associated protein 2-immunoreactive cells (green, with blue [DAPI] counterstain) with neuronal morphology from input of 5 × 10⁶ iPS (line W6). B, Physical interactions of HindIII restriction fragments with the GAD1 TSS. There is increased interaction of sequences positioned −50 kb upstream of GAD1 (red) with the TSS (green) in differentiated cells (bottom graph) but not iPS (top graph). C, Representative agarose gels from 156 bp PCR amplicons of primers encompassing GAD1-TSS-50kbLoop with forward primer from −50 kb sequence (red) and reverse primer from GAD1 TSS (green). The specific product is limited to 3C assays with (+) but not without (−) ligase. D, Bar graphs (mean ± SD, N = 3/group) represent levels of (left) GAD1 RNA after normalization to 18S RNA and (right) GAD1-TSS-50kbLoop. **p < 0.001 (two-tailed t test).