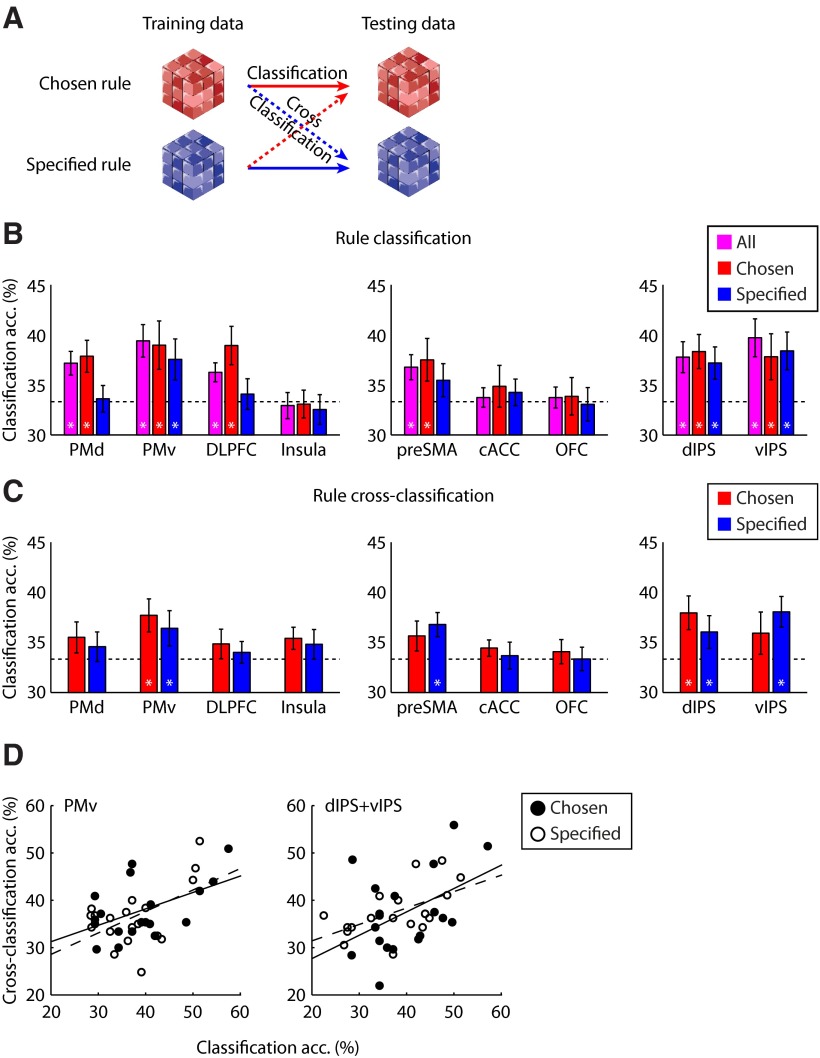
Figure 4.
MVPA of rule representation for chosen and specified contexts. A, Schematic diagram of the MVPA procedure (classification and cross-classification). B, MVPA accuracy (percentage of correct classification) per ROI for the classification of the three rules. Data are shown for all conditions as well as the chosen and specified conditions separately. C, Cross-classification accuracy per ROI for discriminating the three rules. The classifier was trained on data from the specified condition and used to decode rules in the chosen condition (red), and vice versa (blue). Error bars denote SEM. Asterisks indicate regions where decoding accuracy was significantly (p < 0.05, nonparametric permutation tests) different from chance level (33.33%, dashed line). D, Correlation between classification and cross-classification. Each data point represents one participant. The lines indicate the linear regression for chosen (solid line) and specified (dashed line) conditions.

