Figure 7.
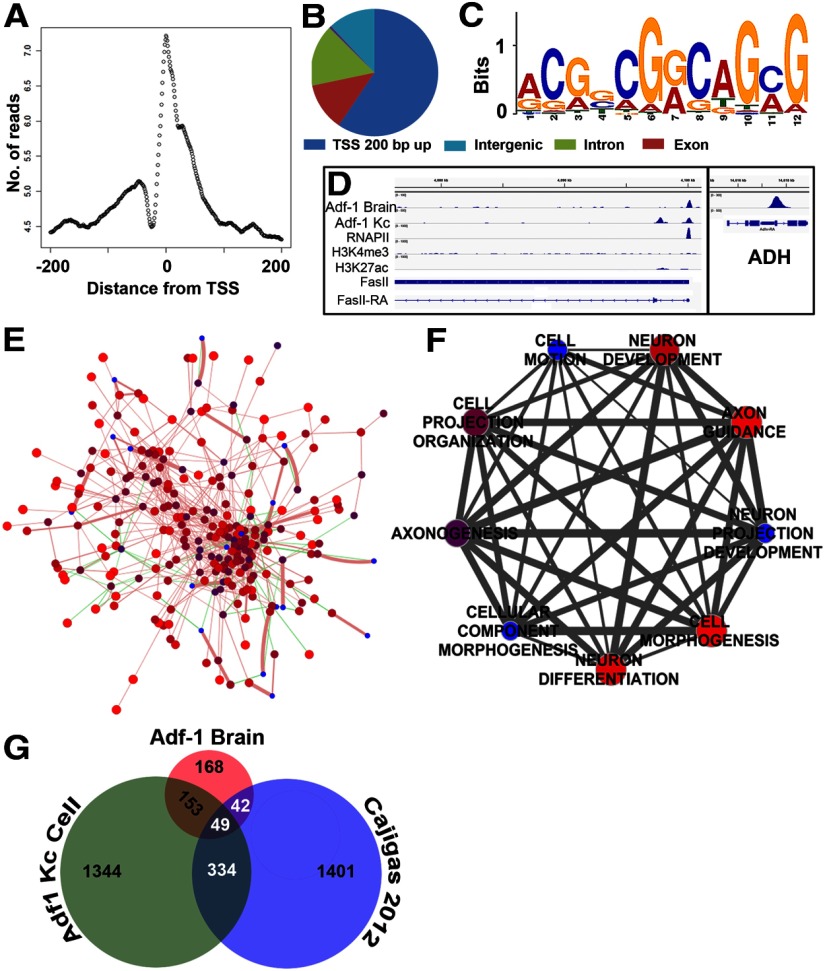
Adf-1 transcriptional targets in the brain identified by ChIP-Seq analysis. A, Adf-1 DNA binding peaks in the brain are enriched close to the TSS. B, Distribution of Adf-1 binding peaks within the genome from brain ChIP-Seq. C, Primary consensus Adf-1 binding sequence derived from brain and Kc cell ChIP-Seq experiments using MEME-ChIP. D, Gene track of FasII showing Adf-1 occupancy in the brain and Kc cells, compared with RNA Pol II, H3K4me3, and H3K27ac chromatin marks in Kc cells. Box shows Adf-1 binding at the ADH gene locus in brains. E, Protein interaction network of genes that contain Adf-1 within 200 bp of their TSS in larval brains created using GeneMania, and published genetic and physical interaction studies in Drosophila. Sphere color and size reflect GeneMania scores (red and larger are higher scores), green lines denote genetic interactions, and pink lines denote physical interactions. Line thickness denotes interaction strength. A total of 82% of input genes (i.e., those that bind Adf-1 in their promoters in the brain) show physical interaction, while 18% have known genetic interactions. F, Clustering of highly significant neuron-related GO terms represented by genes that bind Adf-1 close to the TSS. The size and color of spheres represent p values, and line thickness denotes the number of shared genes between two GO terms. G, Venn diagram representing overlap between genes that bind Adf-1 in brains and Kc cells compared with dendrite-enriched mRNAs in the rodent brain.

