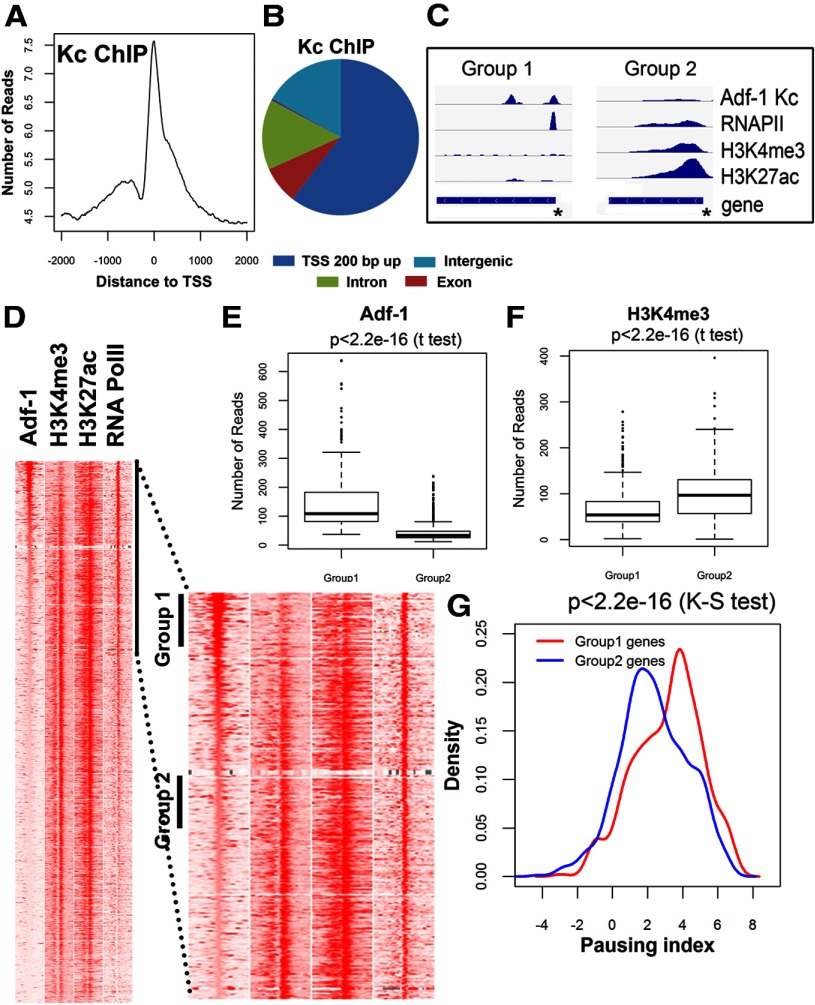
Figure 8.
Adf-1 binding to gene promoters correlates with increased RNA Pol II pausing. A, Adf-1 DNA binding peaks in Kc cells are enriched close to the TSS. B, Distribution of genome-wide Adf-1 binding in Kc cells. C, Two independent genes showing high (left) and low (right) Adf-1 occupancy at the gene promoter (asterisks). RNA Pol II occupancy and the presence of two chromatic marks, H3K4me3 and H3K27ac, are also shown for these two gene regions. D, Heatmaps showing chromatin features around TSSs with different Adf-1 levels. Each panel represents 2 kb upstream and downstream of the TSSs. The sites are ordered by the intensity of Adf-1 at TSSs. Part of the left panel is enlarged to allow detailed visualization. Group 1 and Group 2 TSSs were selected for the examination of pausing index in G. E, F, Box plot of Adf-1 (E) or H3K4me3 (F) levels at TSSs of genes in Group 1 or Group 2 genes from D. G, Distribution of genes in Groups 1 and 2 with respect to pausing index. Group 1 genes (that have a higher enrichment of Adf-1) have a higher pausing index compared with Group 2 genes (that are less enriched for Adf-1 binding).

