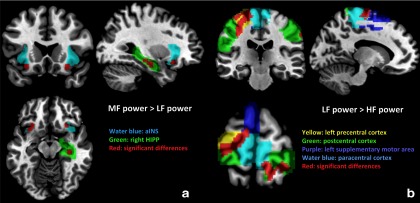
Figure 2.

Altered BOLD frequency power distribution in female IBS compared with female HCs. a, Significant differences of MF versus LF power distribution in female IBS compared with female HCs are shown in red (p < 0.05, FWE corrected). b, ROIs with significant differences between LF versus HF power distribution in female IBS compared with female HCs are shown in red (p < 0.05, FWE corrected).
