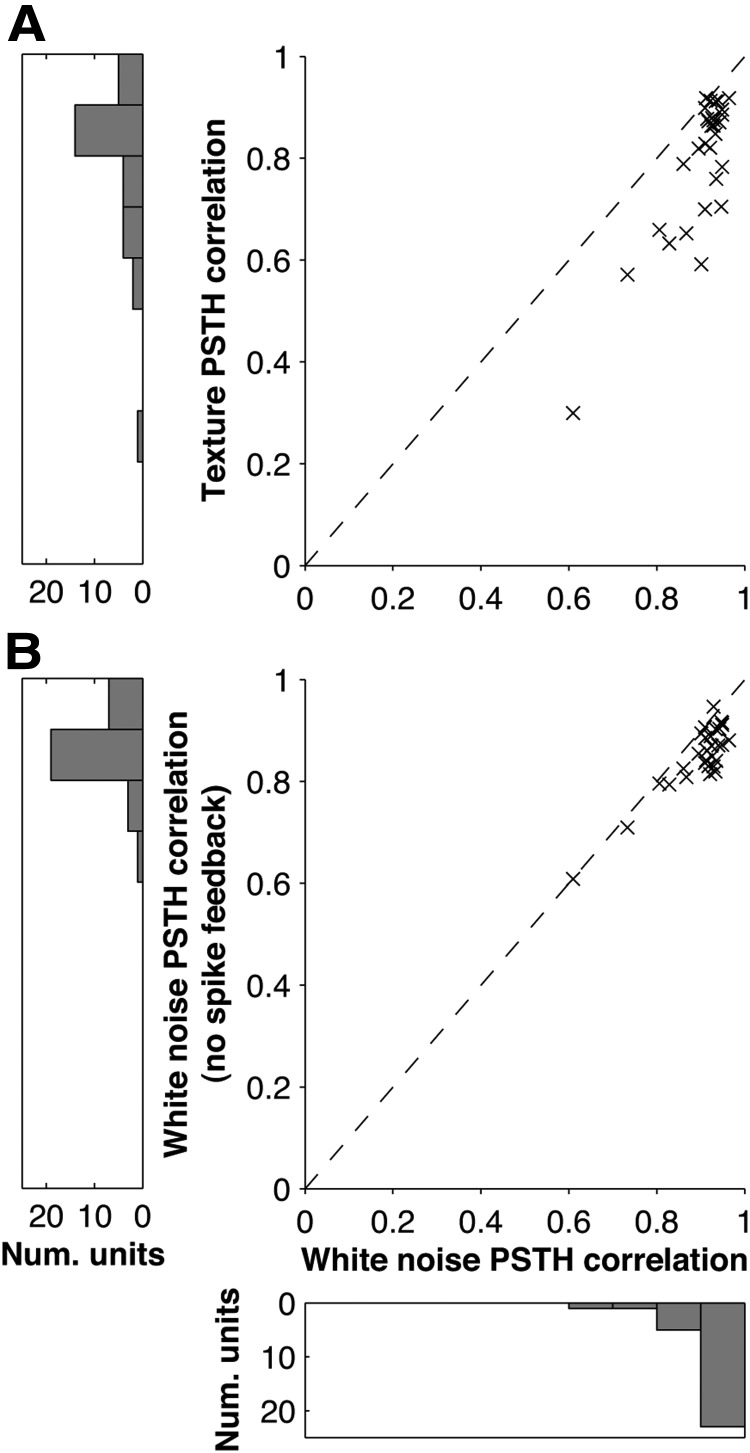
Figure 6.
PSTH Prediction performance of the GLM: population data. A, Each point shows the prediction quality (correlation coefficient between actual and predicted PSTH) for white noise compared with that for texture, for a given unit; 1 ms bins. B, Effect of spike feedback term on PSTH prediction: correlation coefficient between actual and predicted PSTH with spike feedback compared with that without spike feedback for a given unit. Results computed for white noise.

