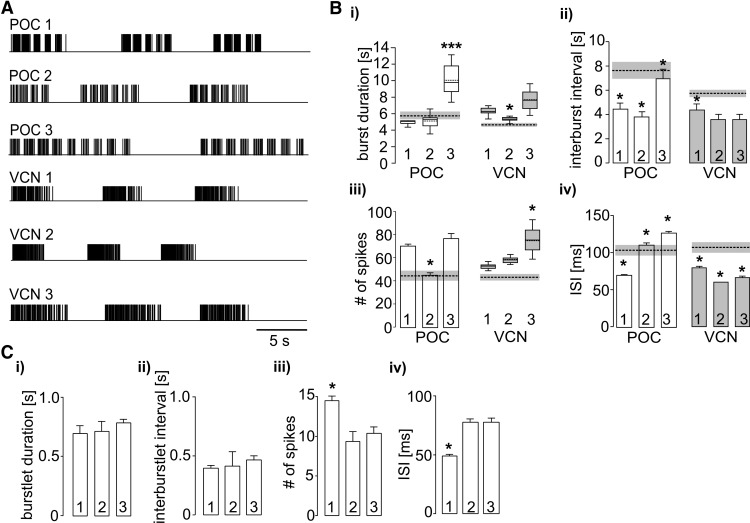
Figure 4.
LG neuron burst parameters during the three POC-triggered and three VCN-triggered gastric mill rhythms selected for LG stimulation during recordings of muscle tension and tooth movements. A, Schematic representation of LG-stimulation pulses during the first two or three of the 10 cycles from the three POC-triggered (POC 1–3) and VCN-triggered (VCN 1–3) gastric mill rhythms. Each pattern was derived from a different preparation. B, Comparison of mean (±SE) LG neuron (i) burst duration, (ii) interburst interval, (iii) number of spikes per burst, and (iv) interspike interval (ISI) for all six stimulation patterns. Box plots: Whiskers, 5–95 percentiles; boxes, 25–75 percentiles; median value, continuous line; average, dashed line. Significance (*p < 0.05; ***p < 0.001, Kruskal-Wallis 1-way ANOVA for non-normally distributed data; 1-way ANOVA for normally distributed data) denotes differences from all other rhythms of the same category (POC or VCN rhythms). Dashed lines and associated gray boxes represent the mean values ± SE, respectively, for a larger set of POC-triggered or VCN-triggered gastric mill rhythms, derived from White and Nusbaum (2011). C, Within-burstlet LG neuron parameters for the three POC patterns. Statistics as in B.

