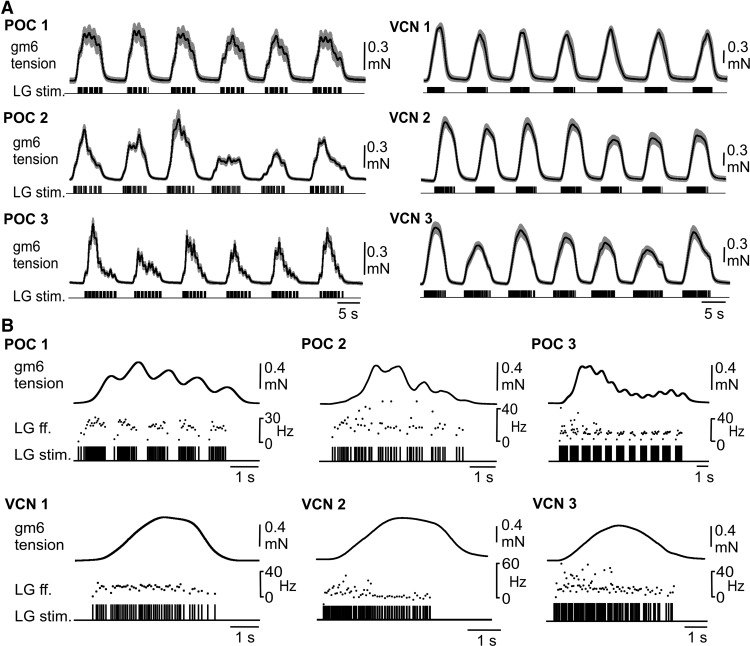
Figure 5.
The gm6ab muscle tension faithfully reflected the distinct LG neuron stimulation patterns derived from realistic POC-triggered and VCN-triggered gastric mill rhythms. A, Average gm6ab muscle tension in nerve-muscle preparations during the first six LG burst stimulations, using the POC-triggered (POC 1–3, n = 8) and VCN-triggered (VCN 1–3, n = 8) gastric mill rhythm patterns shown in Figure 4. Black traces represent mean values; gray clouds represent SD. B, The gm6ab tension response to LG stimulation during one LG burst of an individual POC 1–3 and VCN 1–3 gastric mill pattern. The gm6ab tension response tracked the LG stimulation pattern in all examples, including the pyloric-timed tension decays during each POC burst and the smooth tension increase, plateau, and decrease during each VCN burst. All recordings in B are from the same preparation. LG ff. (middle) represents the instantaneous LG stimulation frequency.

