Figure 9.
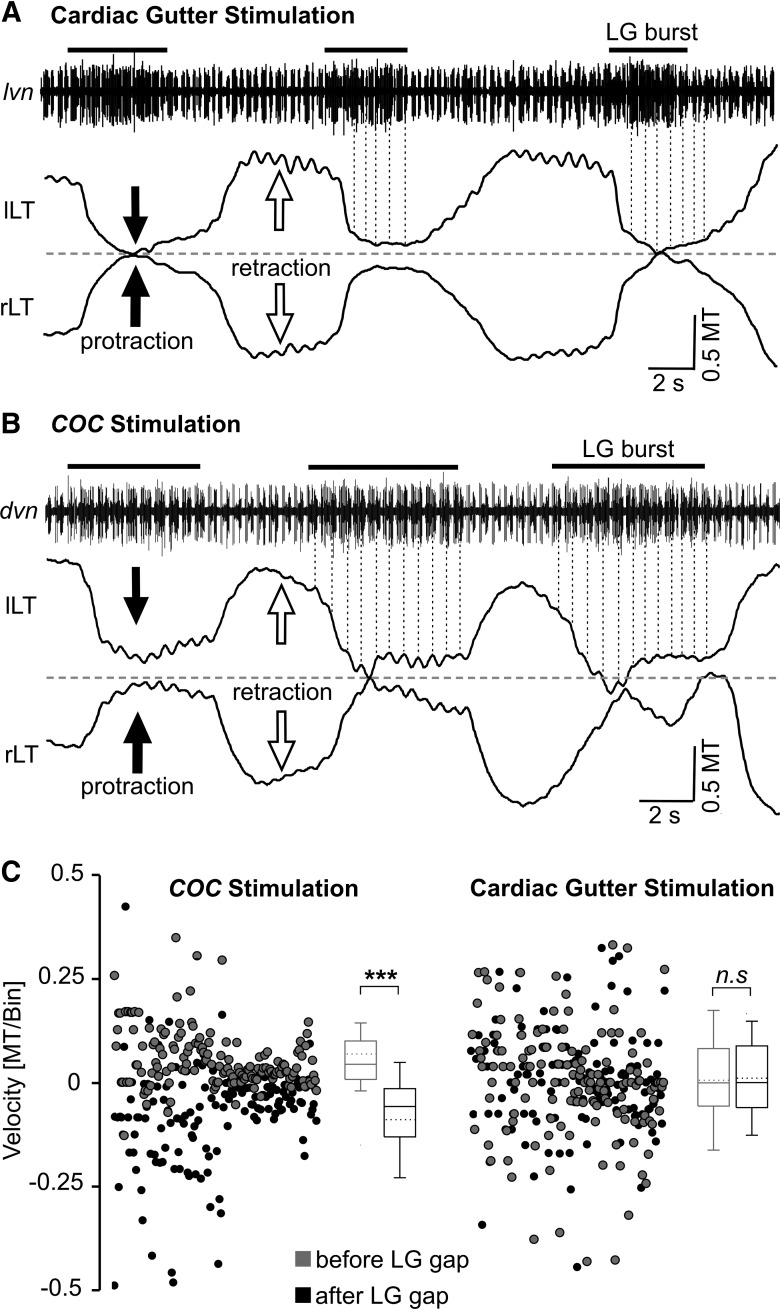
Lateral tooth protraction movements exhibited pyloric timing during coc-triggered (POC) but not cardiac gutter-triggered (VCN) gastric mill rhythms in vivo. A, Original recording of a gastric mill rhythm (lvn) and the associated lateral tooth movements after mechanical stimulation of the cardiac gutter. Note the relatively smooth protraction movements that lack pyloric timing. Dotted vertical lines connect the pyloric rhythm-timed PD neuron bursts (lvn) to the left lateral tooth protraction movements. Pyloric-timed movements were clearly present during retraction. The pyloric rhythm (cycle period, ∼0.85 s) was recorded as a series of relatively brief bursts in two units (larger unit, LP neuron; smaller unit, PD neuron), most evident during the LG interbursts. LG neuron action potentials were approximately the same amplitude as those of LP and are thus not readily distinguished from them when LP is active. Dashed line, Midline of the gastric mill compartment; black bars, LG neuron bursts; lLT, left lateral tooth; rLT, right lateral tooth. Movements were normalized to the width of the medial tooth (MT). B, Original recording of a gastric mill rhythm after coc stimulation. LG neuron activity (dvn) is pyloric rhythm timed, overlapping with and approximately equal in amplitude to that of the pyloric LP neuron (largest units). During protraction, these coactive units exhibit long bursts, due to the LG neuron activity (black bars), relative to retraction when only LP is active. Note the pyloric timing of the protraction movements (dotted lines), and the lack of such timing during retraction. C, Comparison of lateral tooth movement velocities (i.e., slope of movement, see Materials and Methods) in vivo, measured and averaged from 40 ms bins within an interval of 200 ms before the start of the PD burst and a comparable interval after the end of the PD burst, during gastric mill rhythms triggered by coc stimulation (left) and cardiac gutter stimulation (right). Box plots as in Figures 6 and 8. During coc-triggered rhythms, the average movement velocity was positive when measured before the PD burst, while it was negative after the PD burst ended (p < 0.001, n = 8, Mann–Whitney U test). There was no difference between these two time points during cardiac gutter-triggered rhythms (n.s., not significantly different; p = 0.76, n = 8, t test). Note that, while the data from the cardiac gutter-triggered rhythms were normally distributed, we displayed the data distribution as box plots for comparison to the coc-triggered rhythms.

