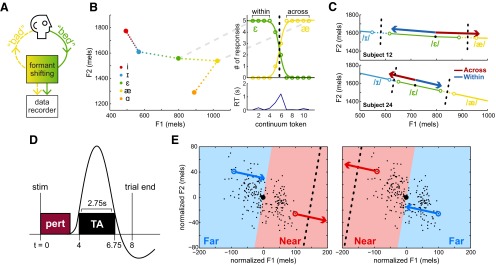
Figure 1.

Experimental design. A, Schematic of formant shift and recording apparatus. B, Categorical perception of self-produced vowels from a sample subject. At left, the small dots between the vowels represent the formant-shifted tokens along each vowel continuum. At right, the identification responses for each vowel continuum were fit to sigmoid curves, with the estimated boundary at the intersection of the two curves (dashed line). Reaction time (RT) peaks near the category boundary. C, Example of counterbalanced subjects with opposite shift patterns. The black filled circle is the median production of /ε/; dashed lines indicate the measured boundaries. D, Trial timeline in the MRI scanner. TA, Acquisition time; pert, formant perturbation. E, Post hoc division of trials into Near and Far conditions based on distance to the boundary (dashed line). Left and right depict the same production distribution perturbed in different directions; that is, the definition of Near and Far regions depends on the direction of formant shift.
