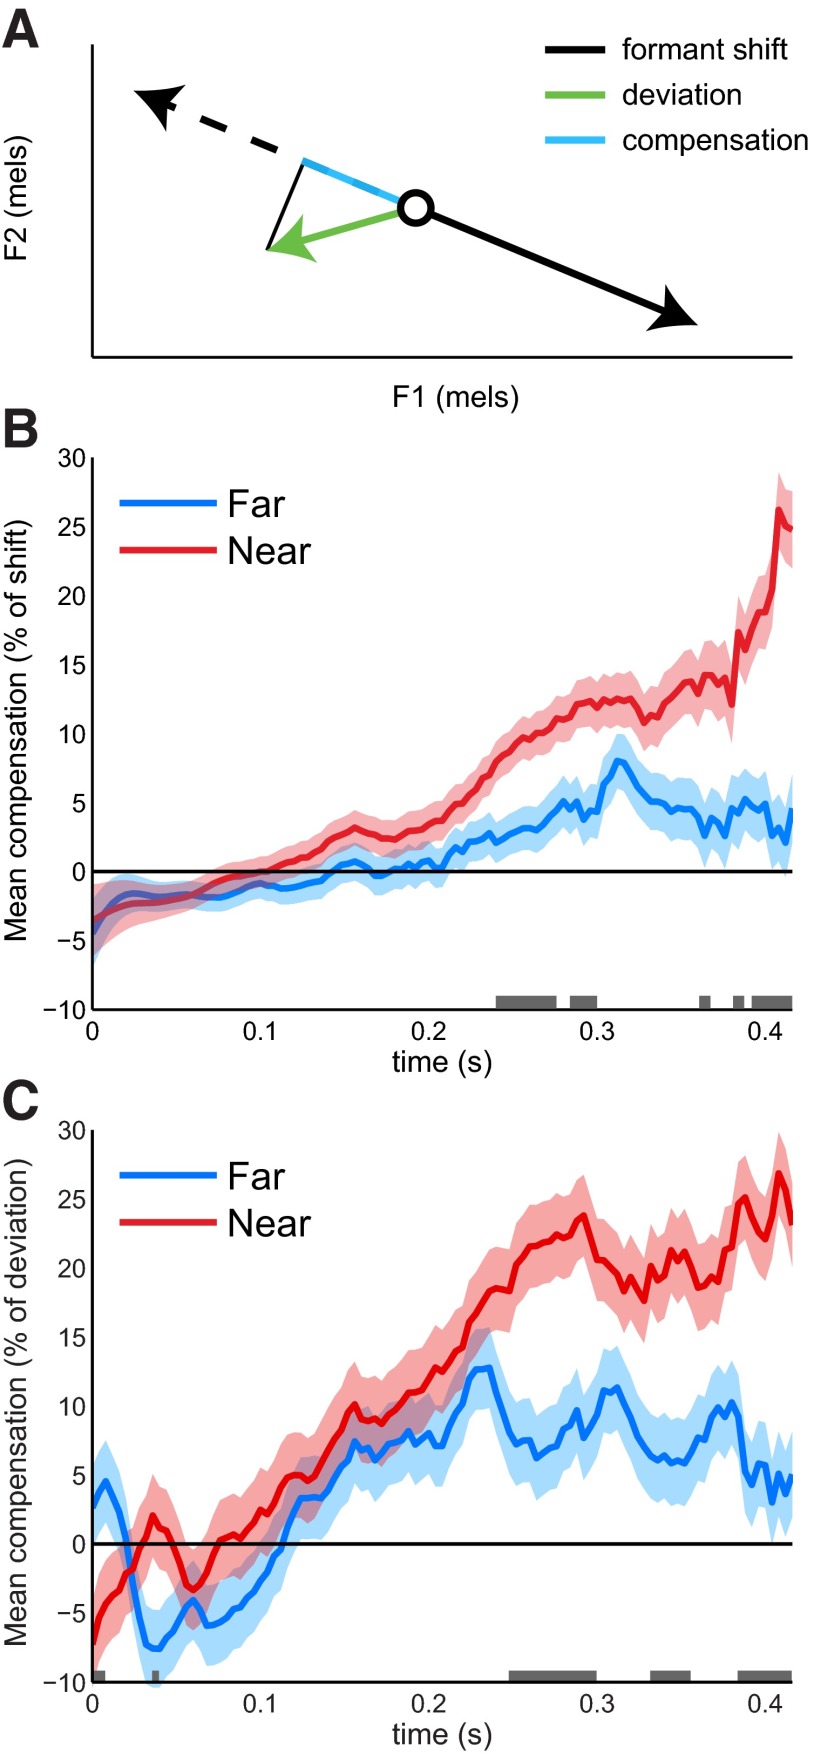
Figure 2.
Behavioral responses to formant shifts. A, Schematic of compensation and efficiency. The shift vector (black solid line) is reflected around the production (open circle) to give the inverse shift vector (dashed line), representing “perfect compensation.” The total shift-evoked deviation (green) is projected onto the inverse shift vector to yield the compensation (blue): the component directly opposing the shift. B, Compensatory changes in output evoked by formant shifts, divided into Near and Far trials. Shaded regions denote SE; gray bars denote time points at which the two conditions significantly differed from each other (p < 0.05). C, Efficiency (ratio of compensation to total deviation) in Near and Far trials.

