. 2013 Jul 2;96(1):42–48. doi: 10.1097/TP.0b013e3182934cee
Copyright © 2013 by Lippincott Williams & Wilkins
This is an open-access article distributed under the terms of the Creative Commons Attribution-NonCommercial-NoDerivitives 3.0 License, where it is permissible to download and share the work provided it is properly cited. The work cannot be changed in any way or used commercially.
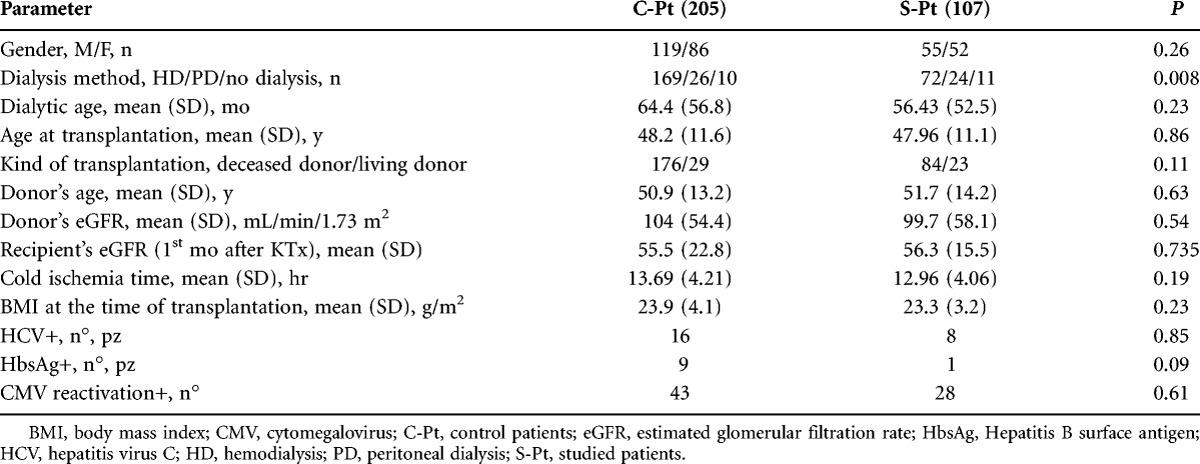
TABLE 1.
Comparison between control (C-Pt) and studied patients (S-Pt)