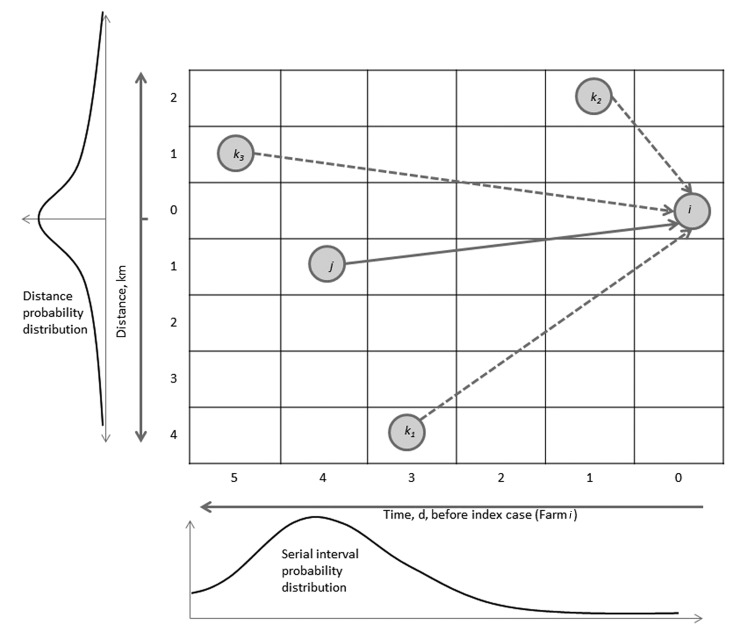
Figure 2.
Schematic representation of the Wallinga-Teunis algorithm extended with spatial information. Farm i could get infection from Farm j, but it also could get infection from Farms k1, k2, and k3. In this example, the most likely time difference between onset of symptoms is 4 days (based on the serial interval distribution, given below the x-axis), and the most likely distance between farms is short (<1 km). Therefore, Farm j is the most likely farm to have infected Farm i (this scenario maximizes the probability in both dimensions). See the online Technical Appendix (wwwnc.cdc.gov/EID/article/19/6/12-1641-Techapp1.pdf) for details.

