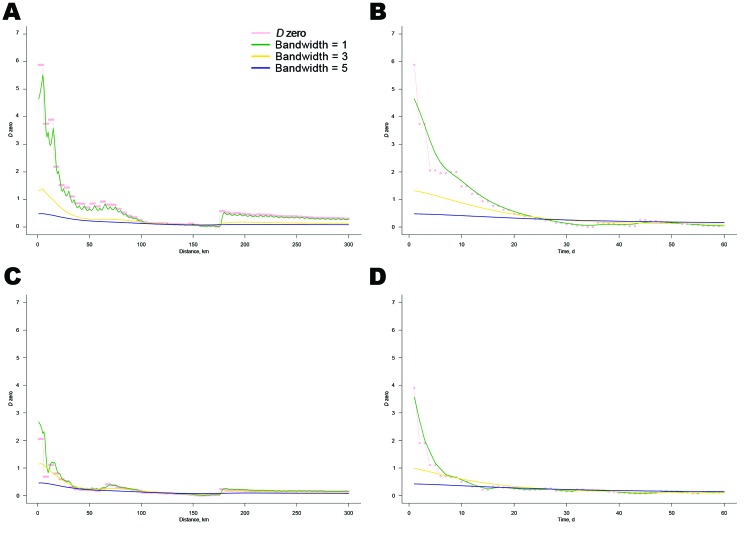
Figure 3.
Distribution of D0 by time and distance [D0(s,t)]. D0(s,t) is a measure of spatiotemporal interaction between cases that was estimated by using the space–time K-function (19,20); the distribution is indicated by the pink dashed line. The green, yellow, and blue lines are the smoothed distributions, which were obtained with bandwidth values of 1, 3, and 5, respectively. A) Plot of D0(s,t) values by distance on day 1. B) D0(s,t) values by time at distance of 5 km. C) Plot of D0(s,t) values by distance on day 5. D) D0(s,t) values by time at distance of 15 km.

