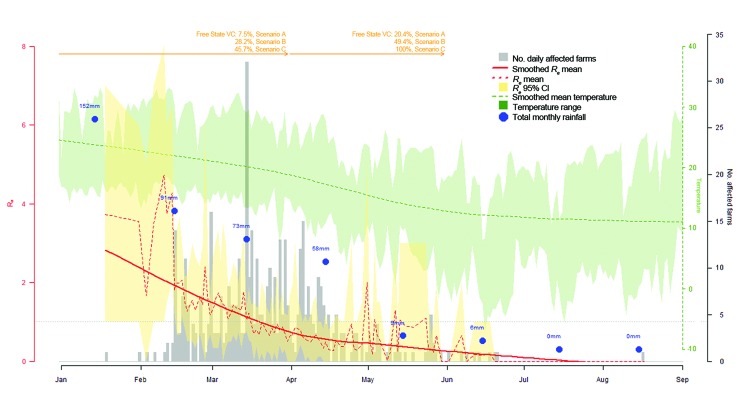
Figure 4.
Rift Valley fever incidence (bars), daily effective reproduction number (Re; red dashed line), and smoothed mean of Re (solid red line) over the course of 2010 epidemic in Free State Province, South Africa. Blue dots, estimates of concurrent total monthly rainfall; dashed green line, average daily temperature. Vaccination coverage (VC) by March 31, 2010, and May 31, 2010, for Scenarios A–C (descriptions follow) are indicated at the top of the graph. Scenarios: Scenario A assumed that vaccination coverage was applied throughout South Africa in proportion to the livestock population; Scenario B assumed that the number of vaccines used in a province over a specific period was proportional to the number of cases reported in that province over that same period; Scenario C assumed that all vaccines were used in Free State Province during Period 2 (January 19–March 31, 2010) and Period 3 (April 1–May 31, 2010) and that no vaccine had been used before the epidemic (Period 1, April 1, 2009–January 18, 2010). The horizontal dashed line represents the threshold value Re = 1.

