
Figure 6.
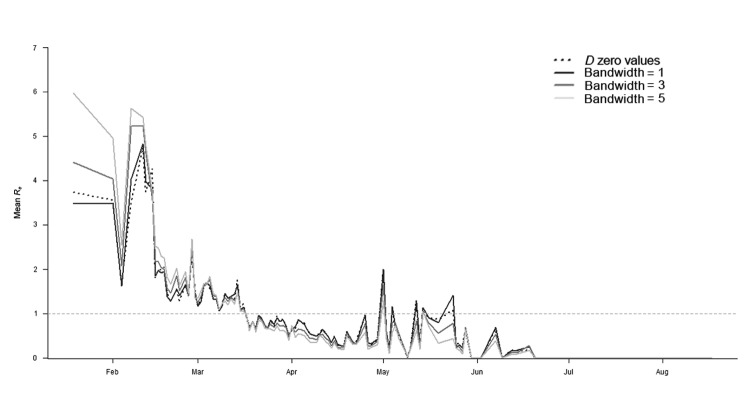
Mean effective daily reproduction number (Re) during Rift Valley fever epidemic, South Africa, 2010. Re was estimated by using D0(s,t) values (dashed black line) and D0(s,t) smoothed surfaces obtained with bandwidth values of 1 (dark gray), 3 (medium gray), and 5 (light gray). D0(s,t) values were estimated by using the space–time K-function (19,20) and are a measure of the spatiotemporal proximity between cases. The horizontal dashed line represents the threshold value Re = 1.