
Fig. 8.
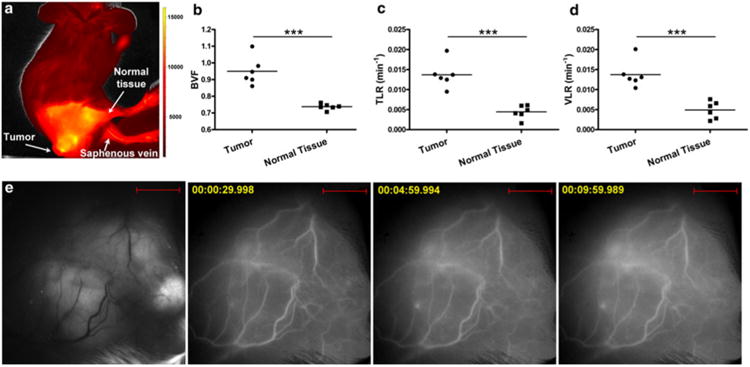
Measurement of vascularity and leakage in a 4T1 subcutaneous tumor model (n = 6). a Positioning of 4T1 bearing mice for measurement in IVIS and visualization of increased signal in the 4T1 tumor compared to normal tissue region at 1 min after intravenous injection of P20-D800. b Quantification of BVF. c TLR. d VLR. e Stereomicroscope imaging of 4T1 tumor blood vessels. The left image shows blood vessels and Venus positive tumor fluorescence as seen using a GFP filter set. The three additional panels show imaging with a Cy5 filter set at different time points (30 s, 5 min, and 10 min) after intravenous injection of P20-D680 tracers. Note increase in signal outside blood vessels over time, indicating vascular leakage in the tumor. * p < 0.05, ** p < 0.01, *** p < 0.001