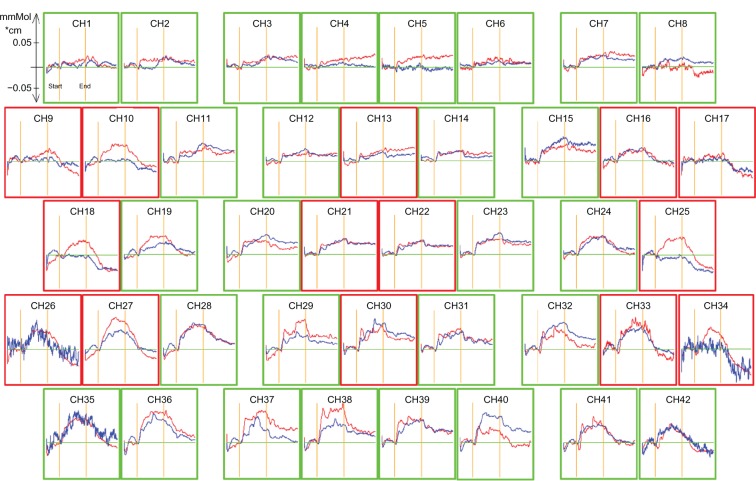
Figure 1.
Grand-average waveforms of changes in oxygenated hemoglobin concentration in controls (red line) and the group with obsessive-compulsive disorder (blue line). The areas enclosed with red frames show the regions of interest. The x-axis shows time course (s) and the y-axis shows the change in oxygenated hemoglobin concentration (mM • cm). Grand-average waveforms of changes in oxygenated hemoglobin concentration in healthy controls increased during the task period, but did not increase markedly in the obsessive-compulsive disorder group.
Abbreviation: CH, channel.

