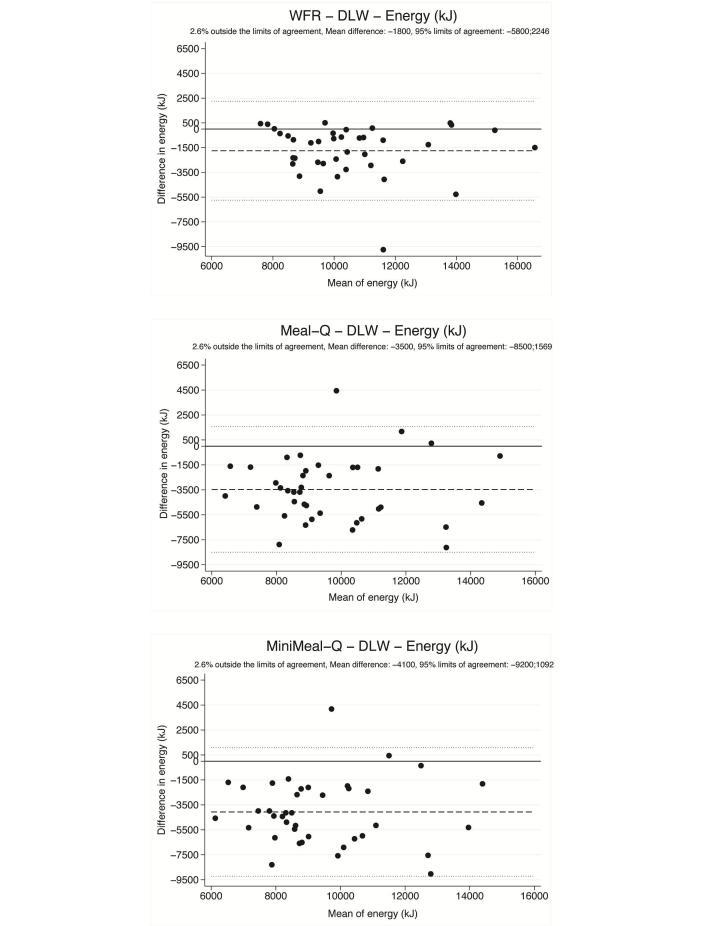
Figure 3.
Bland-Altman plots showing the differences in energy intake assessed with the WFR, Meal-Q, and MiniMeal-Q and the energy expenditure measured with DLW plotted against the mean of the 2 methods (n=39). Each data point represents 1 participant. The long-dashed line shows the mean difference. The short-dashed lines show the 95% limits of agreement (mean difference ±2 SD).

