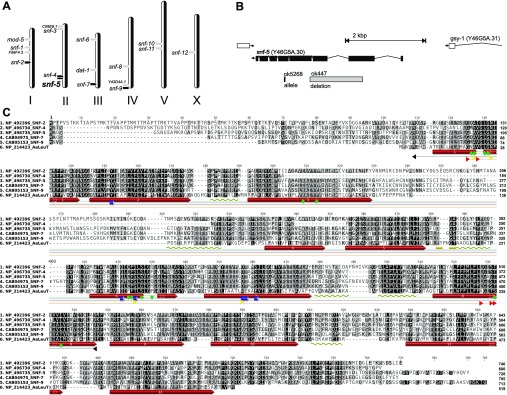
Fig. 2.

(A) Relative distribution of SLC6 transporters (gray arrowheads) and putative nematode NATs (black arrowheads) in C. elegans genome. (B) Localization and splicing diagram of snf-5 (SNF-5) in chromosome II. Gray bar indicates the deletion fragment in the mutant nematode that was analyzed in the present work. (C) Alignment of nematode NATs relative to the sequence and experimentally determined 2D structure of the bacterial transporter LeuT. Color shapes indicate relative positions of sites that are respectively implicated in: green, amino acid coordination in occlusion state of the transporters; yellow, first Na+ binding; red, second Na+ binding; blue, Cl− binding; light gray, outside gate; black, inside gates. Transmembrane domain numbers inside red bars indicate specific transmembrane domains. Gold arrows and coils indicate relative positions of conserved β-strands and sub-membrane α-helices.
