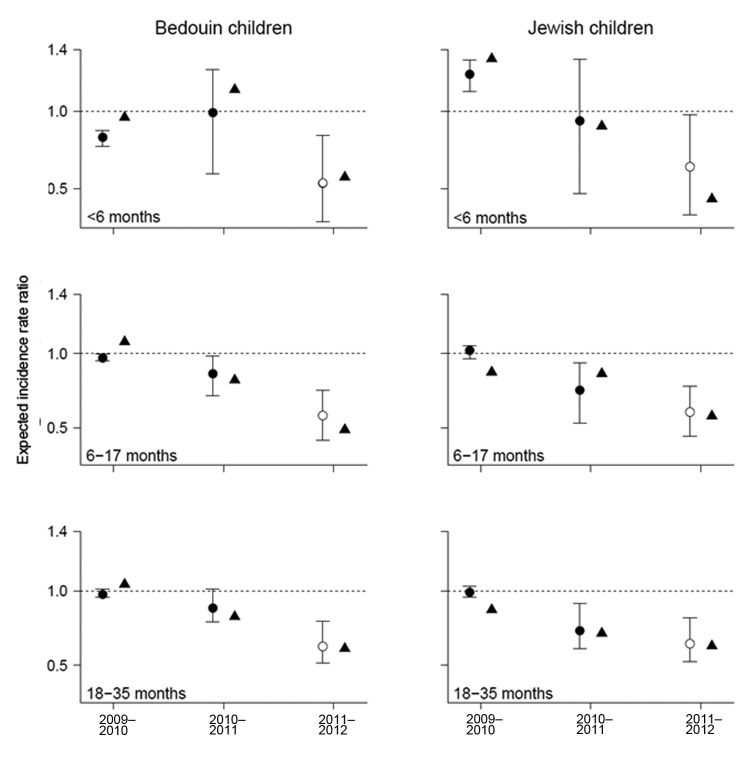
Figure 2.
Observed (triangles) and expected (closed circles) change in RCAP incidence for each year compared with the 2004–05 through 2007–08 average, expressed as incidence rate ratios, southern Israel. Expected values were determined from a model fit to data from 2004–05 through 2010–11, with the 2011–12 values (open circles) extrapolated based on the observed virus activity.

