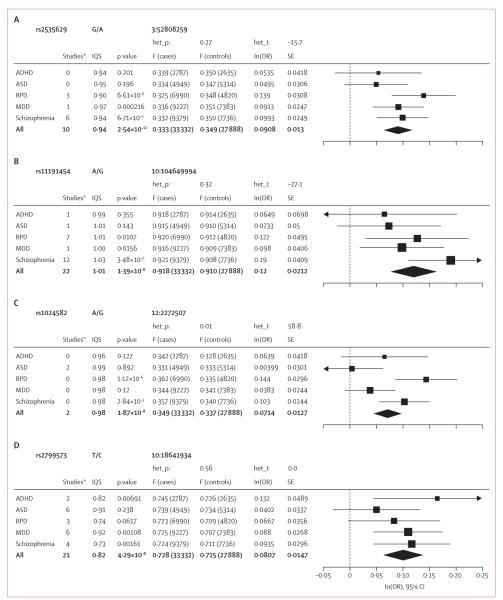
Figure 2. Association results and forest plots showing effect size for genome-wide significant loci by disorder.
Data in parentheses are numbers of cases or controls. Het_p=p value for the heterogeneity test. Het_I=heterogeneity test statistic. IQS=imputation quality score (INFO). ln(OR)=log of the odds ratio (OR). F=frequency. SE=standard error of the log OR. ADHD=attention deficit-hyperactivity disorder. ASD=autism spectrum disorders. BPD=bipolar disorder. MDD=major depressive disorder. *Number of studies in which the variant was directly genotyped.

