Figure 4.
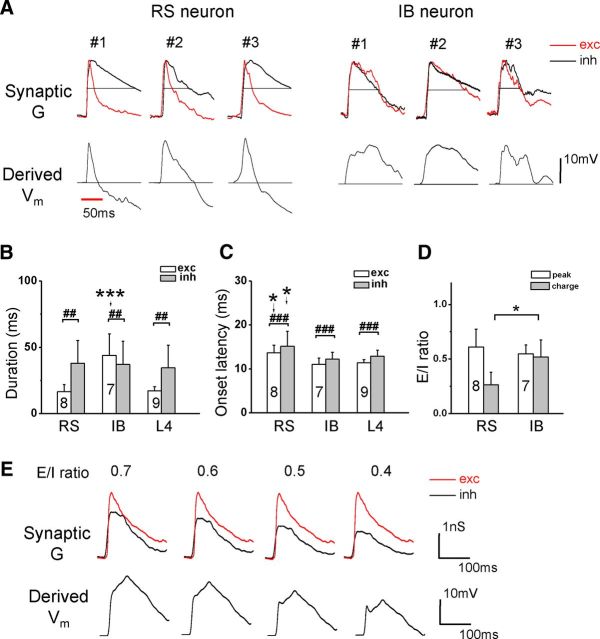
Temporal properties of synaptic inputs to different types of neurons. A, Top, Normalized synaptic conductances (red for excitation, reversed in polarity) evoked by CF tones for three RS and three IB neurons. Dash line marks the half-maximum level. Bottom, The Vm response generated in the neuron model by integrating the synaptic conductances shown above. Dash line labels the level of the resting potential. Red line indicates the tone duration. B, Average half-peak durations of evoked excitatory (red) and inhibitory (black) conductances. For excitation, one-way ANOVA (F = 21.5, p = 8.1 × 10⁻⁶) and Scheffé's test showed a significant difference between RS–IB and IB–L4 groups (***p < 0.0001). For inhibition, there was no significant difference among cell groups (one-way ANOVA, F = 0.28, p = 0.76). ##p < 0.01, paired t test within cell type. C, Average onset latencies of CF-tone-evoked excitation and inhibition. One-way ANOVA (F = 7.6, p = 0.0032 for excitation; F = 3.54, p = 0.0475 for inhibition) and Scheffé's test (*p < 0.05) showed significant differences between RS–IB and RS–L4 groups. ###p < 0.001, paired t test within cell type. D, Average E/I ratio measured by peak response amplitude (white) or integrated charge (gray). *p < 0.05, two sample t test with unequal variance. E, The excitatory response of an IB neuron was artificially scaled down at different levels as to change E/I ratio (the E/I ratio value is given on top). The resulting Vm response from integrating the excitation (exc) and inhibition (inh) shown in the top panel consistently exhibited prolonged depolarization.

