
Figure 1. Concentration independence and conformational dependence of Vc.
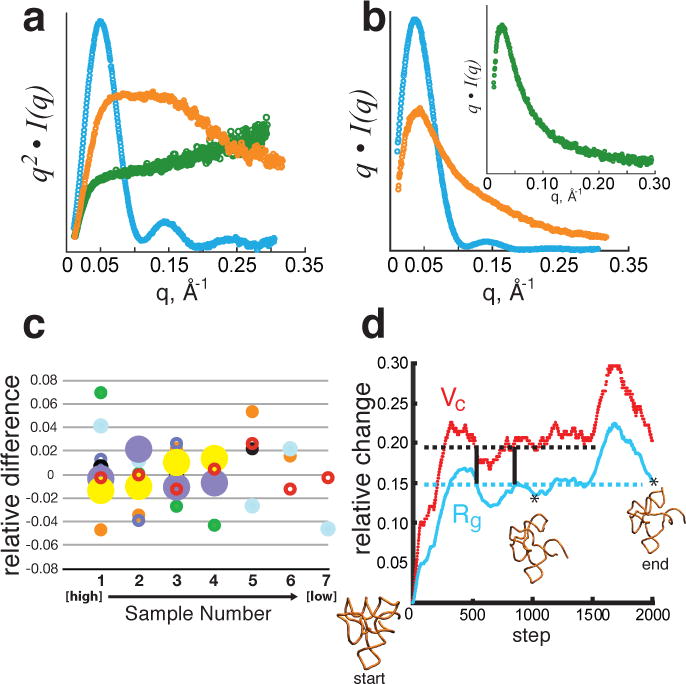
(a, b), Experimental SAXS data plotted on a relative scale for glucose isomerase (cyan), 94-nucleotide SAM-1 riboswitch in the absence of Mg2+ (orange) and RAD51AP1, an intrinsically unfolded protein (green). a, Data transformed as the Kratky plot, q2• I(q) vs. q, reveal the parabolic convergence for a folded particle (blue) and divergence for a flexible (orange) or fully unfolded (green) particle. b, Data plotted as q • I(q) vs. q show convergence for both folded and flexible particles. Inset demonstrates convergence for a fully unfolded polymer. c, Concentration independence of Vc for experimental SAXS data. For each of 7 samples, relative difference is calculated as the deviation from the mean normalized to the mean. Concentrations ranged from 0.2 to 3 mg/mL for glucose isomerase (cyan), P4–P6 domain (open red), xylanase (orange), TyMV UUAG TLS RNA (solid black), del8 RNA (open purple), Atu RNase P(open black), SAM-1 riboswitch with Mg2+ and ligand (closed purple), SAM-1 riboswitch in the absence of Mg2+ (solid green). X-axis (Sample Number) refers to the different concentrations for each sample increasing from left to right. d, Correlated changes in Vc (red) and Rg (cyan) for conformations of SAM-1 riboswitch (PDB 2GIS) simulated from molecular dynamics with CNS28. Horizontal lines demonstrate for Rg or Vc that a single value can map to multiple conformations. Dual specification of both Rg and Vc reduces multiplicity (vertical bars). Relative change represents the difference calculated from the starting model 2GIS. Asterisks denote the time step of the displayed conformation.