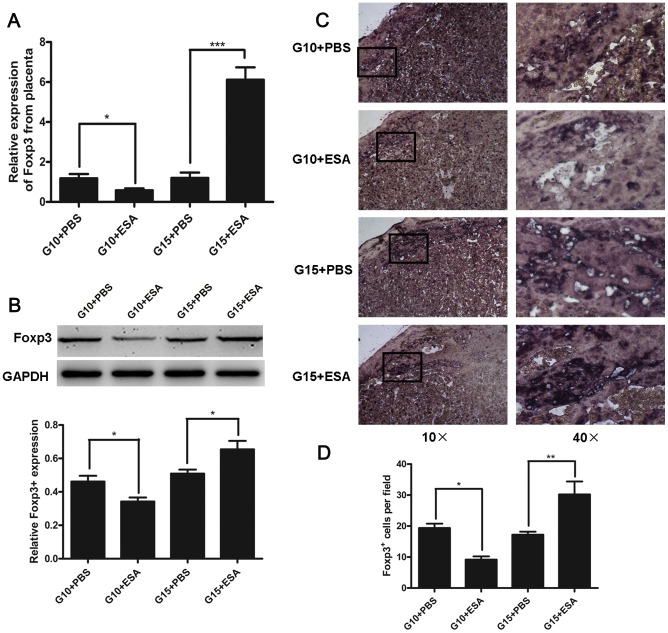
Figure 3. Foxp3 mRNA and protein levels at the maternal-fetal interface of mice with T. gondii ESA injection at G10 and G15.
(A) Foxp3 expression levels in placentas from T. gondii ESA-injected and PBS-injected mice measured by real-time quantitative PCR. The data were normalized to individual β-actin mRNA expression and expressed as fold change relative to control mice. Data represent means ± SD from groups of seven mice assayed individually. (B)Top panel, Foxp3 protein was analyzed by Western blot after the injection at G10 or G15 as indicated. Bottom panel, densitometric analysis of Foxp3 expression was conducted by Western blot. One representative result of three independent experiments performed is shown. (C) The distribution of Foxp3+-cells in the placentas of T. gondii ESA-injected and PBS-injected mice as determined by immunohistochemical staining. (D) The average number of Foxp3+-cells per field. Data represent means ± SD from groups of four mice assayed individually. Statistical differences between groups are shown as follows: * p<0.05; **p<0.01; *** p<0.001.

