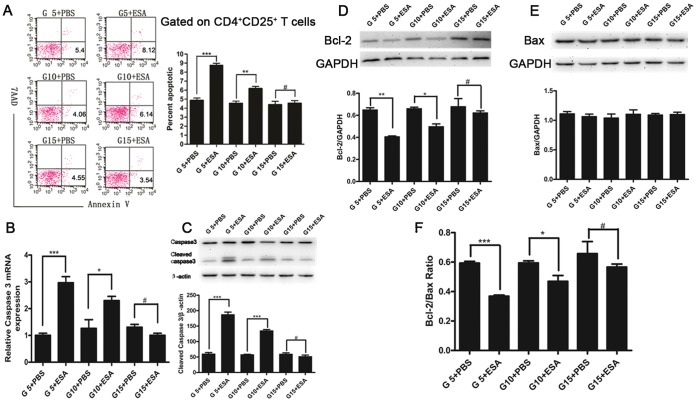
Figure 5. Apoptosis of CD4+CD25+ T cells in spleens of pregnant mice after T. gondii ESA injection at G5, G10 and G15.
(A) A gate was set on CD4+CD25+ T cells, and the percentage of apoptotic CD4+CD25+ T cells was determined by Annexin V and 7AAD staining. (B) The expression of Caspase 3 from the purified CD4+CD25+ T cells at the level of mRNA. (C) The expression of Caspase 3 from the purified CD4+CD25+ T cells at the level of protein, which was quantified by densitometric analysis with Image J. (D) Top panel, Bcl-2 levels was analyzed by Western blot. Bottom panel, Bcl-2 levels were quantified by densitometric analysis with Image J. (E) Top panel, Bax levels was analyzed by Western blot. Bottom panel, Bax expression was quantified by densitometric analysis with Image J. (F) Bcl-2/Bax ratio. Statistical differences between groups are shown as follows: * p<0.05; ** p<0.01; *** p<0.001; # p>0.05.

