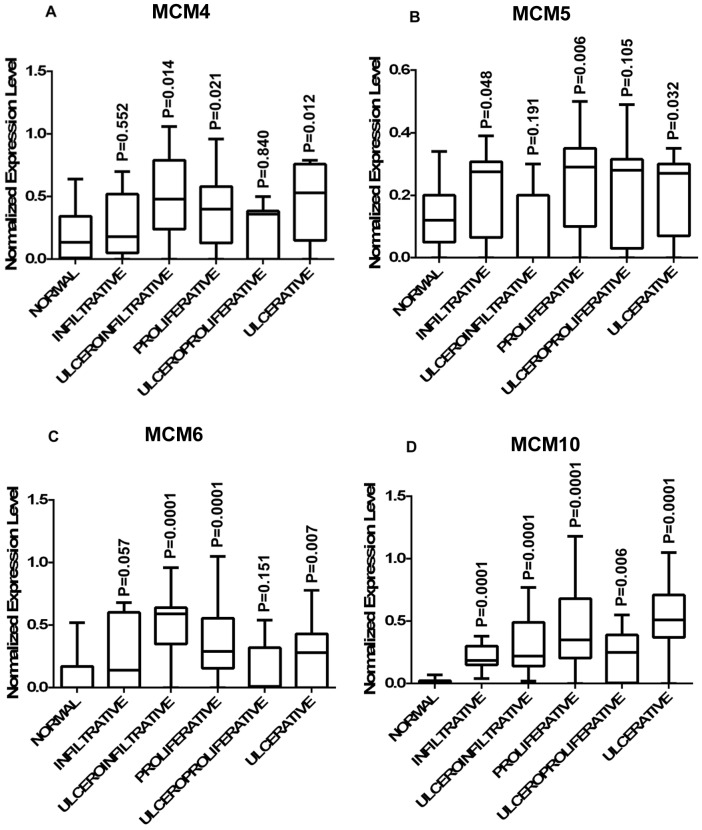
Figure 4. Distribution of expression of MCMs in different types of lesion of cervical cancer.
Differential expression of (A) MCM4; (B) MCM5; (C) MCM6 in different types of lesions viz. infiltrative (n = 08), ulceroinfiltrative (n = 11), proliferative (n = 21), ulceroproliferative (n = 09), proliferative (n = 11) as compared to normal; (D). MCM10 show significant up regulation compared to normal in all different types of lesions. A box in a given box plot represents the interquartile range (25th percentile to 75th percentile), the middle line denotes median and the extreme ends of the whiskers marks the minimum and maximum values. P-values indicated over each box represent the asymptotic significance (2-tailed) of Mann-Whitney test comparing normal to a particular group.

