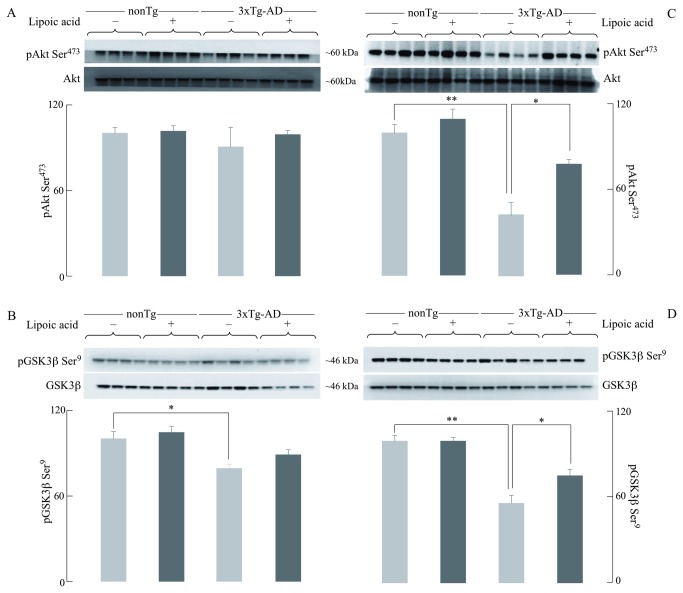
Figure 5. Effect of lipoic acid on age-dependent changes in brain pAkt and pGSK3β.
Western blot analyses of the levels of pAkt Ser473 and pGSK3β Ser9 in whole brain from nonTg and 3xTg-AD mice +/- lipoic acid. Left panels (A and B) correspond to data from young mice and right panels (C and D) to data from old mice. Bar graphs show the average pAkt Ser473 (normalized to loading control, Akt) and pGSK3β Ser9 (normalized to loading control, GSK3β) with error bars indicating ± SEM. Total n = 48, n ≥ 5/group. *P ≤ 0.05, **P ≤ 0.01.

