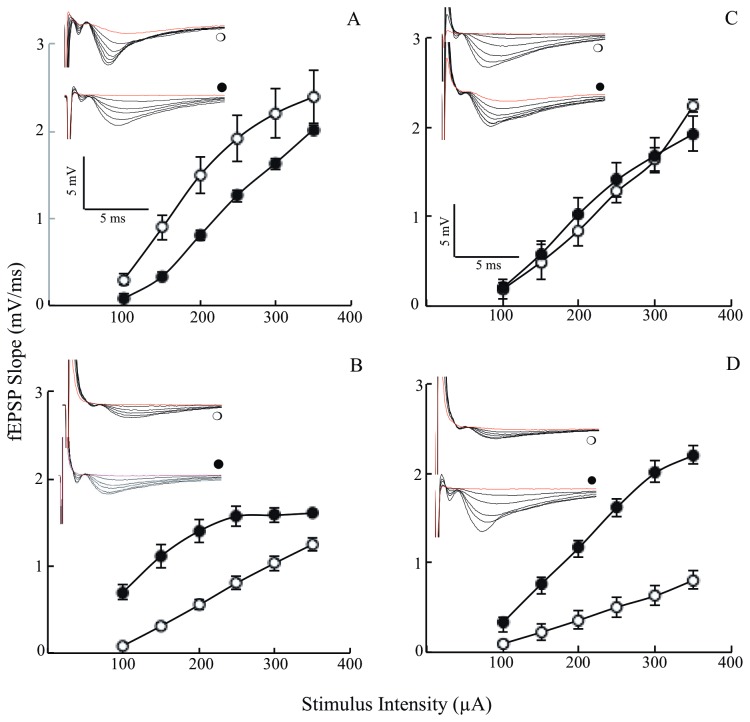
Figure 7. Age dependent changes in I/O of the 3xTg-AD mice and the effect of lipoic acid.
I/O relationships after applying increasing stimulation to the stratum radiatum of the CA1 region in the hippocampus for nonTg and 3xTg-AD mice +/- lipoic acid and recording the output (electrophysiology techniques as described in the Materials and Methods section). Left panels (A and B) correspond to data from young mice and right panels (C and D) to data from old mice (open circles). Control; (closed circles) Plus lipoic acid. fEPSP slope (mV/ms) plotted against the corresponding stimulation intensity for (A) young non-Tg mice (p < 0.001; F = 27.1 repeated measures ANOVA; young nonTg n = 4, young nonTg + lipoic acid n = 7); (B) young 3xTg-AD mice (p < 0.002; F = 20.4 repeated measures ANOVA; young 3xTg-AD n = 8, young 3xTg-AD + lipoic acid n = 6). (C) old nonTg mice (p < 0.004; F = 13.9 repeated measures ANOVA; old nonTg n = 6, old nonTg + lipoic acid n = 6). (D) old 3xTg-AD mice (p < 0.00003; F = 46.4 repeated measures ANOVA; old 3xTg-AD n = 6, old 3xTg-AD + lipoic acid n = 7). The inserts in each panel are the corresponding representative I/O raw data as obtained during the electrophysiology recordings: (open circles) control and (closed circles) plus lipoic acid. Total n = 51 slices, n ≥ 5 slices/group and at least 3-4 animals/group.

