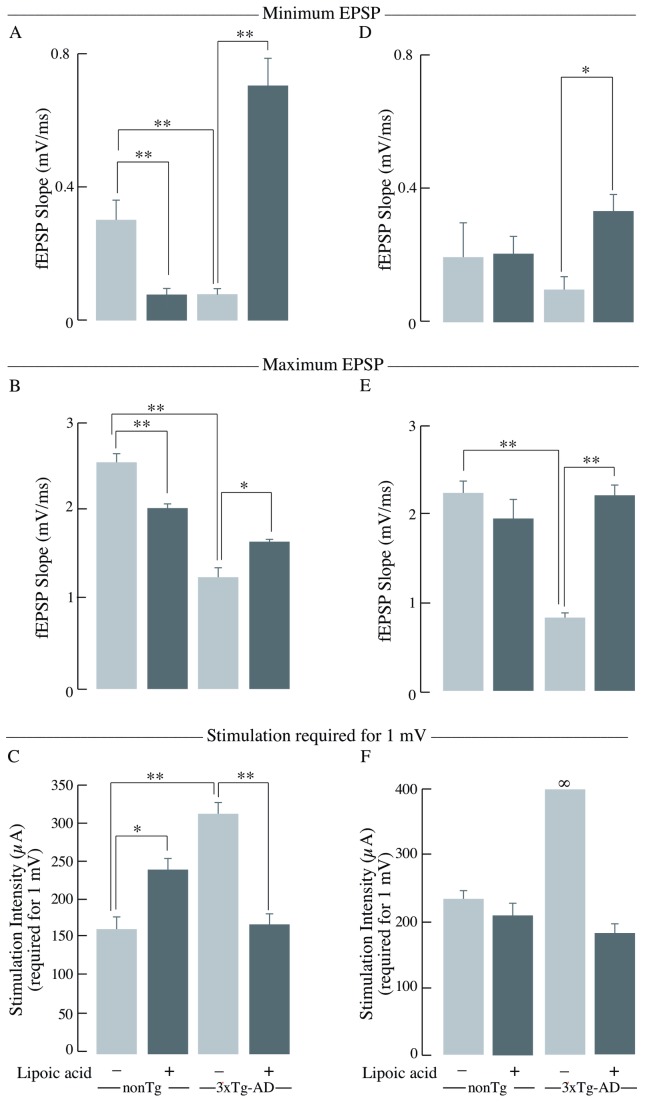
Figure 8. Minimum EPSP, maximum EPSP, and stimulation intensity required to reach 1mV.
Bar graphs of the levels of minimum EPSP, maximum EPSP, and stimulation intensity required to reach 1 mV as obtained during the I/O recordings in the stratum radiatum of the hippocampal CA1 region for nonTg and 3xTg-AD mice +/- lipoic acid. Left panels (A, B, and C) correspond to data from young mice and right panels (D, E, and F) to data from old mice. Bar graphs showing the minimum EPSP or the fEPSP slope values at 100 µA and the error bars indicating ± SEM for (A) young mice and (D) old mice. Bar graphs showing the maximum EPSP or the fEPSP slope values at 350 µA and the error bars indicating ± SEM for (B) young mice and (E) old mice. Bar graphs showing the stimulation intensity required to reach at least 1mV output and the error bars indicating ± SEM for (C) young mice (p < 0.01; F = 8.9 repeated measures ANOVA) (young nonTg n = 7, young 3xTg-AD n = 7) and (F) old mice (p < 0.003; F = 14.6 repeated measures ANOVA) (old nonTg n = 6, old 3xTg-AD n = 7). Total n = 51 slices, n ≥ 5 slices/group and at least 3-4 animals/group. *P ≤ 0.05, **P ≤ 0.01.

