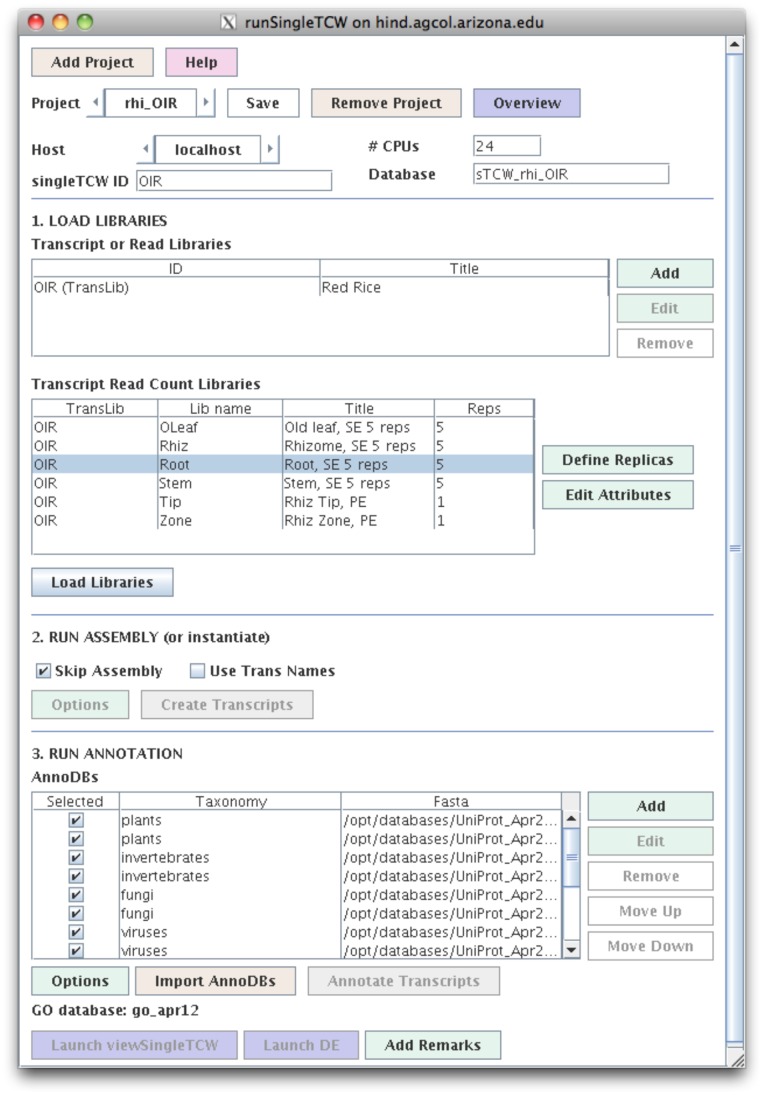
Figure 1. The runSingleTCW interface.
This shows the configuration for building the red rice singleTCW database. The “Add” button in the LOAD LIBRARIES section opens a window (not shown) for defining the location of the sequence file and read count files; when the window is closed, information about the read count files is automatically entered into the “Transcript Read Count Libraries” table. The “Define Replicas” button opens a window to allow the user to define the replicas, which results in an updated “Transcript Read Count Libraries” table. In this case, there were 6 tissues types where the first 4 have 5 replicas each. As there was just one pre-assembled transcript data set, it was instantiated without assembly. The 13 annotation databases along with the GO database were identified in the third step.

