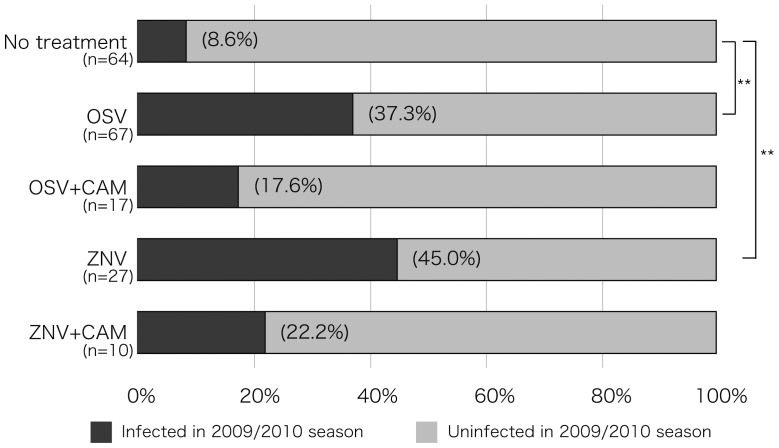
Figure 1. Re-infection rate in 2009/2010 season.
The re-infection rate in 2009/2010 season in children who were infected with IAV during the 2008/2009 season and either untreated or treated with OSV, OSV+CAM, ZNV and ZNV+CAM. Data show the percentage of infected children in each group. * P<0.05, * * P<0.01, versus no treatment (Fisher's exact test with Bonferroni correction).

