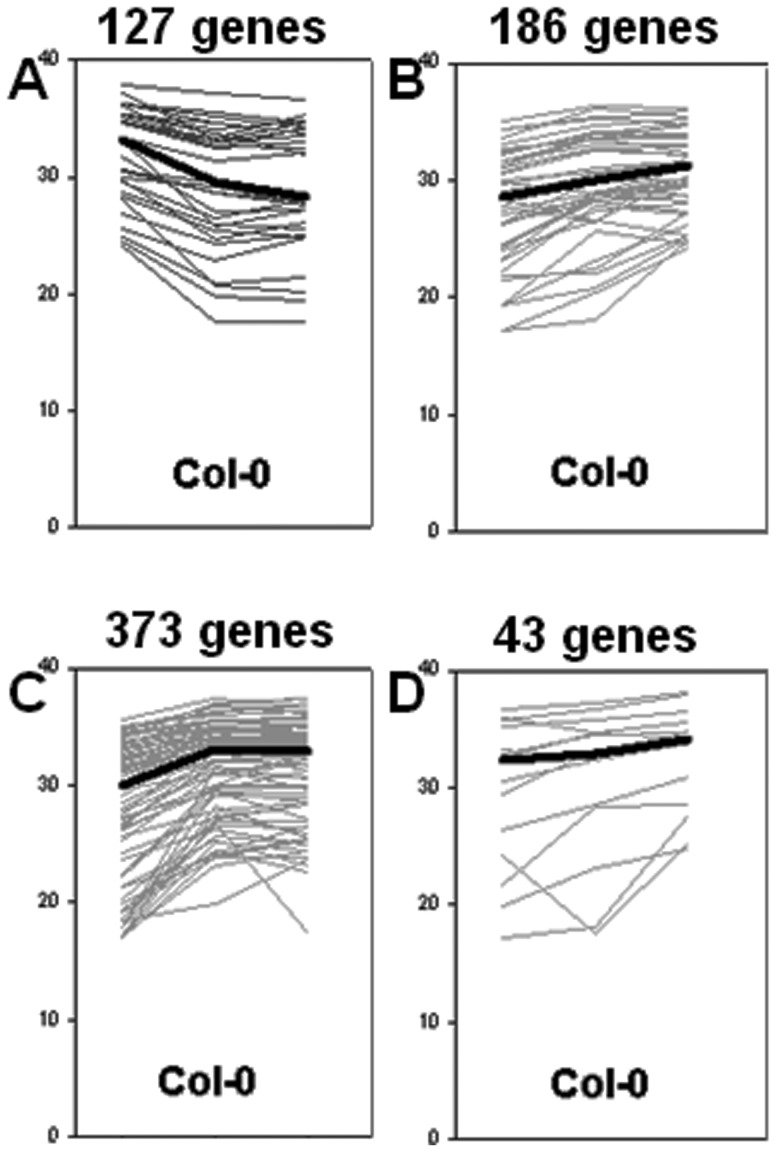
Figure 5. Cluster analysis.
K-means clustering revealed four main expression patterns of TF genes in Col-0 embryogenic cultures. The levels of expression changes are given as 40-ddCt. The cluster analysis shows up-regulation of the great majority of TFs (B, C, D), and down-regulation of a small group of TFs (A). Increased TF expression was either restricted to the early stage of SE (C), or was observed during both SE stages, early and advanced (B, D).

