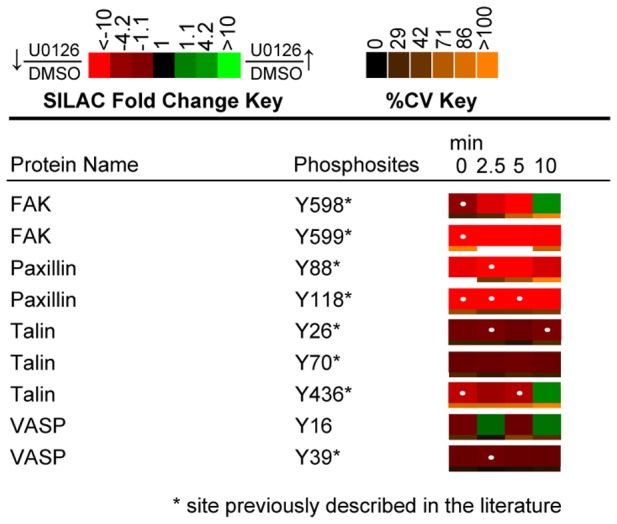
Figure 12. Quantitative phosphoproteomic analysis of proteins implicated in integrin signaling.

Heatmaps were calculated from the averages of four biological replicate experiments. White dots within the SILAC heatmaps indicate a statistically significant difference (q value <0.02) in the comparison between U0126-treated and DMSO-treated control Jurkat T cell SILAC ratios for that time point.
