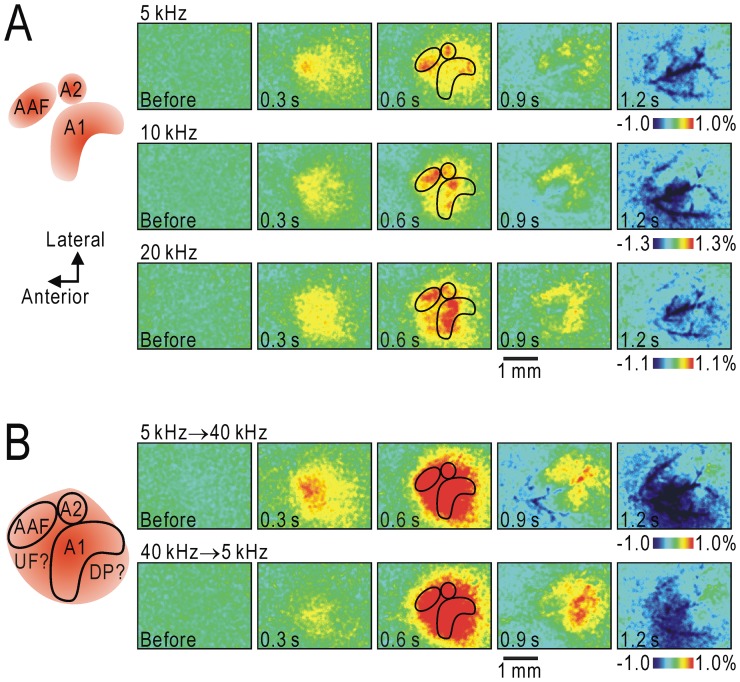
Figure 1. Responses to tonal stimuli in the auditory cortex.
(A) Responses to AM sounds at 5 kHz (upper), 10 kHz (middle) and 20 kHz (lower panels). Time after stimulus onset is shown in each panel. Inset shows schematic drawing of the fluorescence responses to AM sounds mainly in A1, AAF and A2. (B) Responses to upward (upper panels) and downward (lower panels) FM sweeps ranging between 5 and 40 kHz for 0.5 s. Inset shows the fluorescence responses to FM sweeps in a large area including A1, A2, AAF, UF and DP. Images in (A) and (B) were obtained from the same mouse. The schematic outlines of A1, AAF and A2 are superimposed on the images.

