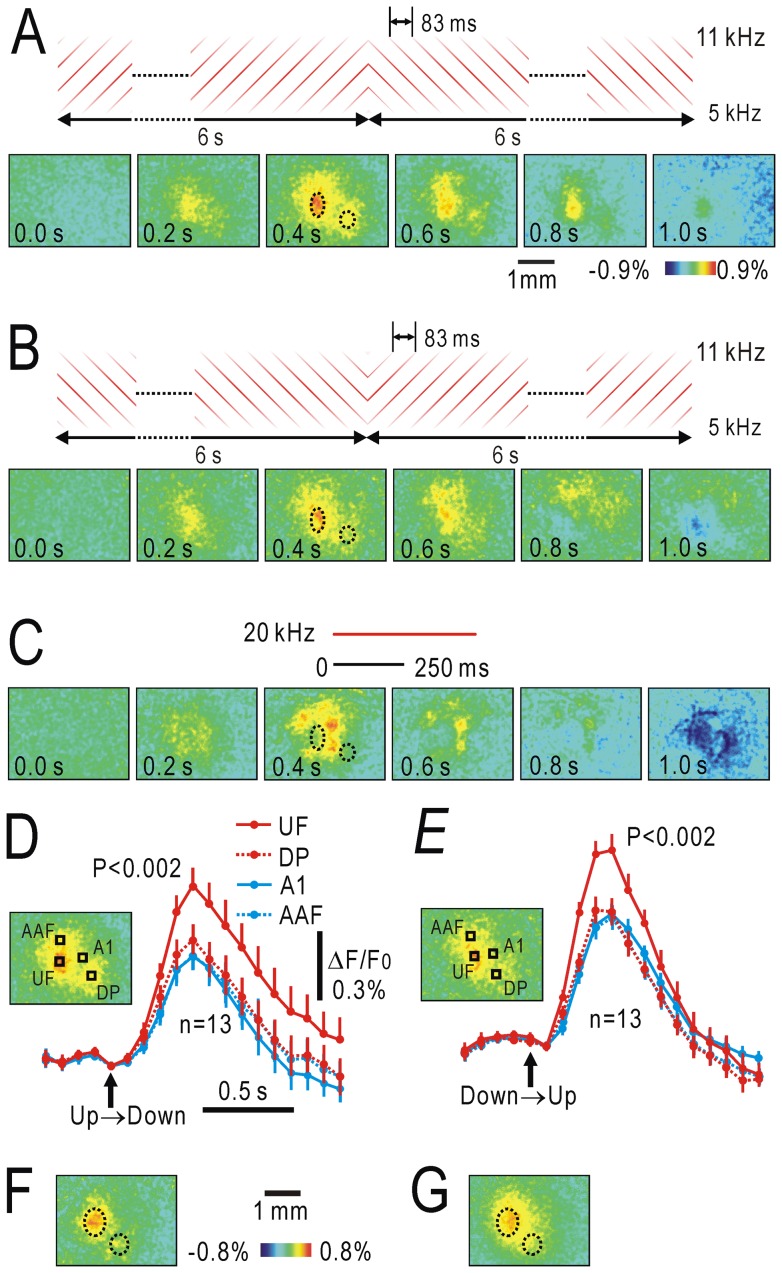
Figure 2. Responses to FM direction reversal.
(A) Responses to FM direction reversal from upward to downward. Inset shows the stimulus condition used for producing the responses. Time after the direction reversal is shown in each panel. The same areas that approximately corresponded to UF and DP are marked with dotted lines to assist comparison of responses shown in (A–C). The schematic drawing shows superimpused FM sweeps. (B) Responses to direction reversal from downward to upward. (C) Responses to a 20 kHz AM sound. Responses in (A–C) were recorded from the same mouse. (D) Time courses for fluorescence changes in response to FM direction reversal from upward to downward recorded in A1, AAF, UF and DP. Mean and S.E.M obtained from 13 mice are shown. The image shows the windows in A1, AAF, UF and DP at which fluorescence changes were measured. The peak amplitude in UF was significantly larger than those in DP, A1 and AAF (P<0.002, respectively). (E) Time courses for fluorescence changes in response to FM direction reversal from downward to upward. The peak amplitude in UF was significantly larger than those at DP, A1 and AAF (P<0.002, respectively). (F) Cortical responses to direction reversal of randomly-spaced FM sweeps from upward to downward. (G) Responses to direction reversal of randomly-spaced FM sweeps from downward to upward.

