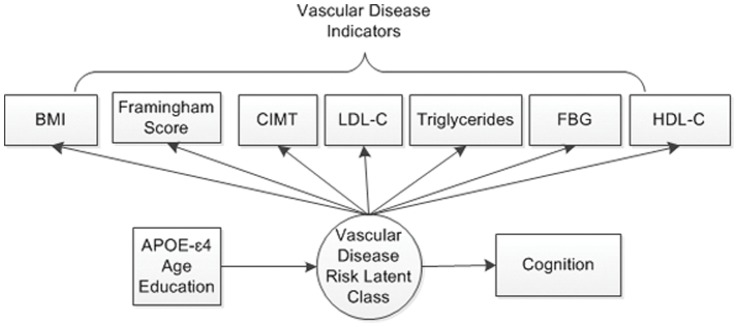
Figure 2. Diagram illustrating the latent profile model.

BMI = Body mass index; CIMT = Carotid artery intima-media thickness; LDL-C = Low density lipoprotein-cholesterol; HDL-C = High density lipoprotein-cholesterol; FSG = Fasting blood glucose.

BMI = Body mass index; CIMT = Carotid artery intima-media thickness; LDL-C = Low density lipoprotein-cholesterol; HDL-C = High density lipoprotein-cholesterol; FSG = Fasting blood glucose.