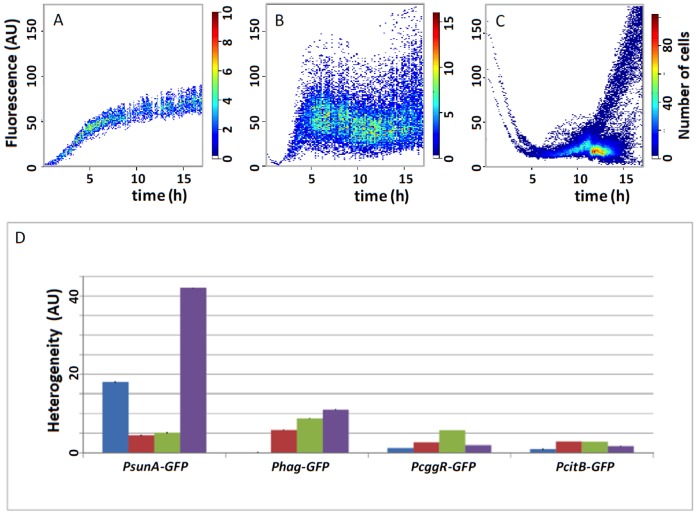
Figure 3. Heatmap plots created using the R script in Figure 2.
(A) B. subtilis cells expressing a fusion of the IPTG-inducible Pspac promoter with GFP [6], [7] show homogeneous fluorescence. (B) B. subtilis cells expressing a fusion of the authentic promoter of the sunA gene to GFP show heterogeneous fluorescence when grown on a Luria Bertani agarose medium. (C) B. subtilis cells expressing the same sunA promoter GFP fusion as in B show bistable heterogeneous fluorescence when grown on an M9 agarose medium. Note that at early time points already two populations of cells with differing fluorescence intensities can be distinguished. AU, arbitrary units. (D) Bar diagrams for easy comparison of the outcomes of multiple heterogeneity measurements during growth on M9 medium as shown in panels A-C. At t = 2 h, cells are in the exponential growth phase (blue bars); at t = 5 h, the highest numbers of cells are observed (red bars); at t = 10 h, a minimum in the cell numbers has been reached due to cell death (green bars); and at t = 17 h, the surviving cells have resumed growth (purple bars). Heterogeneity is expressed in arbitrary units (AU).

