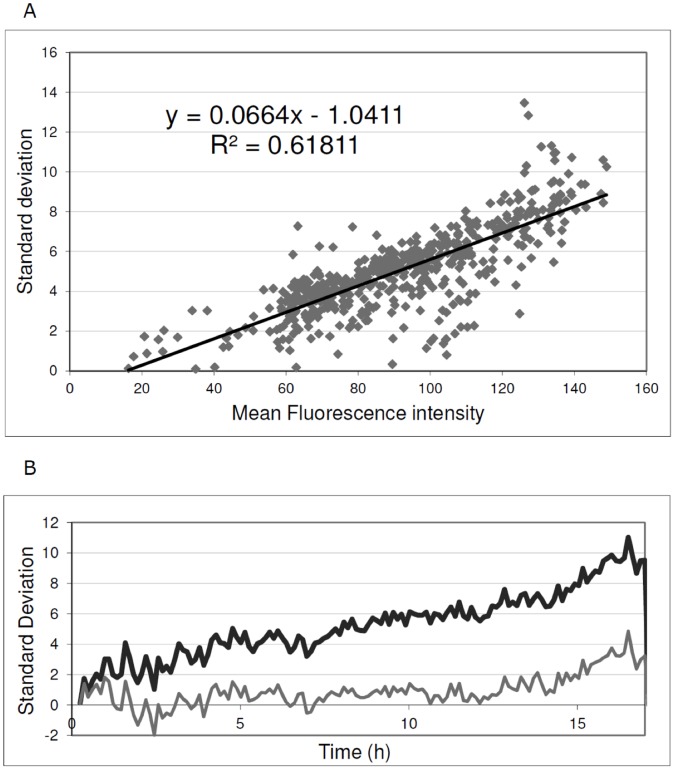
Figure 4. Quantification of expression heterogeneity.
To obtain baseline values for GFP expression heterogeneity, a B. subtilis Pspac-GFP strain was used in which the fluorescence intensity of the cells can be varied by varying the amount of the inducer IPTG in the growth medium. Importantly, the variation in GFP fluorescence in this cell population is minimal compared to cells expressing GFP from non-engineered promoters. Therefore, the observed variation can be regarded as a baseline for GFP expression heterogeneity. (A) Standard deviation in the fluorescence intensity of individual cells of B. subtilis Pspac-GFP as a function of the mean fluorescence intensity of the cell population. The analysis included 535 measurements collected from four cultures supplemented with IPTG to 0.05 mM, 0.1 mM, 0.5 mM, or 1 mM. (B) Example to illustrate the effectiveness of the applied heterogeneity correction. When applied to a Pspac-GFP strain grown in the presence of 0.05 mM IPTG the correction shows close to zero levels of expression heterogeneity over a period of at least 12 h. At later time points cells started to lyse in this experiment resulting in a slightly increased GFP expression heterogeneity. Black line, raw fluorescence data; Grey line, Pspac-GFP subtracted data.

