
Fig. 1.
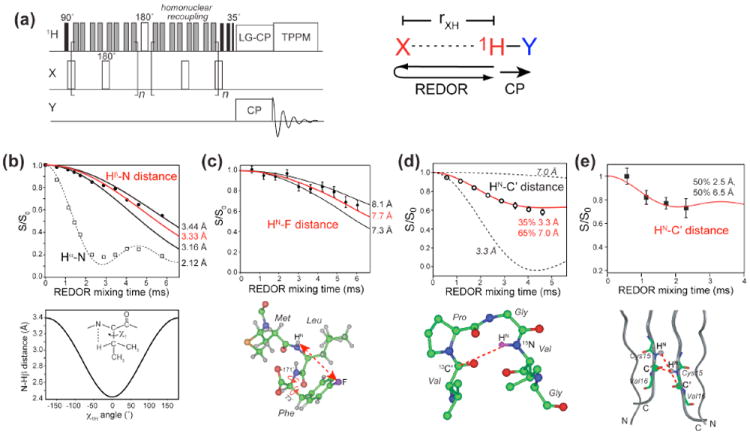
(a) Pulse sequence of the Y-detected 1H-X REDOR experiment. Several applications of this method are shown in (b-e). (b) 13C-detected intra-residue Hβ – N and Hα-N REDOR dephasing in the model compound N-acetyl-valine 8. The Hβ – N distance depends on the χ1 angle as shown below the REDOR panel, where χ1H ≡ N − Cα − Cβ − Hβ = χ1 − 120°. (c) 15N-detected inter-residue HN-19F REDOR dephasing of the tripeptide formyl-Met-Leu-Phe 9. (d) 15N-detected inter-residue HN-13C’ REDOR dephasing between Val6 C’ and Val9 HN in the elastin-mimetic peptide (VPGVG)3 10. (e) Intermolecular HN-C’ distances in Cys15 of the antimicrobial peptide, PG-1 11. The REDOR data restrain the peptide to be parallel packed in an NCCN fashion.