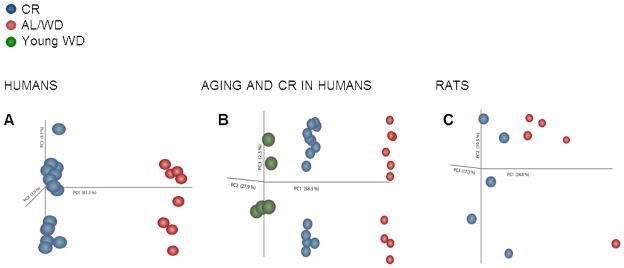
Fig. 1. Principal component analysis (PCA) and parametric analysis of gene-set enrichment (PAGE) were performed on microarray data from humans and rats.


PCA of (A) humans on caloric restriction (CR) (blue) or ad libitum (AL)/Western diet (WD) (red), (B) those of younger subjects on a WD (green), and (C) rats. n=5 for both AL and CR-fed rats; n=10 and n=15 for humans on WD and CR, respectively; n=5 for younger individuals on WD. (D) PAGE comparing the top 100 significantly pathways up-regulated (red) or down-regulated (blue) by either the WD or CR (WD-Y=younger individuals eating Western diets (WD); WD-M=middle-aged individuals on WD).
