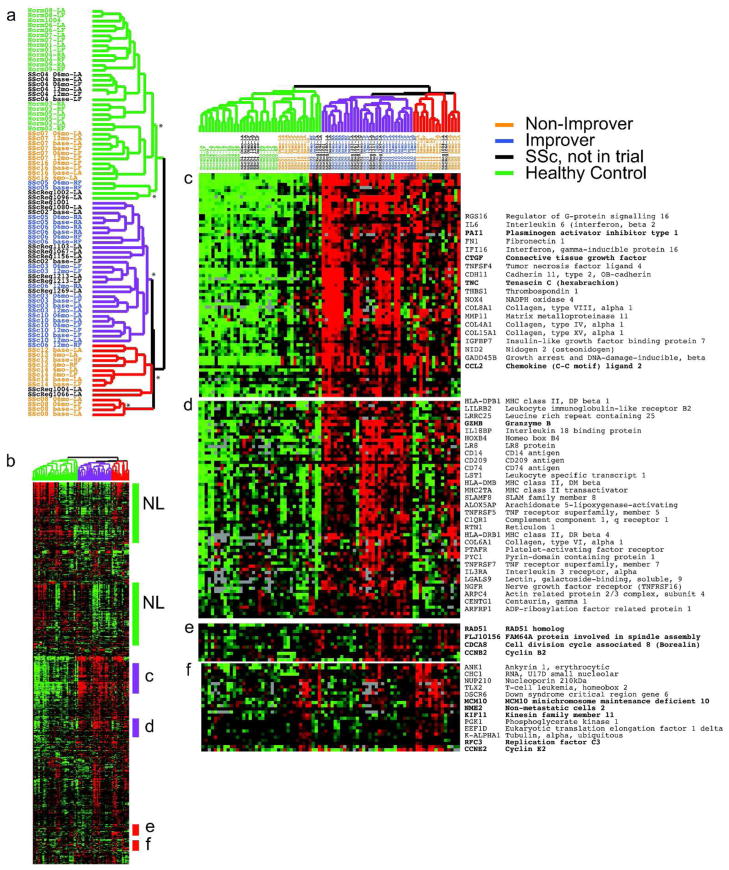
Figure 2. Improvers cluster within the inflammatory intrinsic subset.
We selected 2775 intrinsic genes with a False Discovery Rate of 3%. Genes and microarray samples were clustered hierarchically. The sample dendrogram (a) shows the statistically significant intrinsic groups. Branch points above each * are significant at p ≤ 0.005. The dendrogram branches are colored to reflect the major intrinsic subsets of normal-like (green), inflammatory (purple) and diffuse-proliferation (red). Patient identifiers indicate systemic sclerosis samples (SSc) and normal healthy controls (Norm); those in the MMF study are colored to reflect improvers (blue) and non-improvers (orange). b) Overview of the gene expression profiles. c and d) Inflammatory clusters, e) mitotic fibroproliferative cluster, f) DNA replication proliferation cluster.

