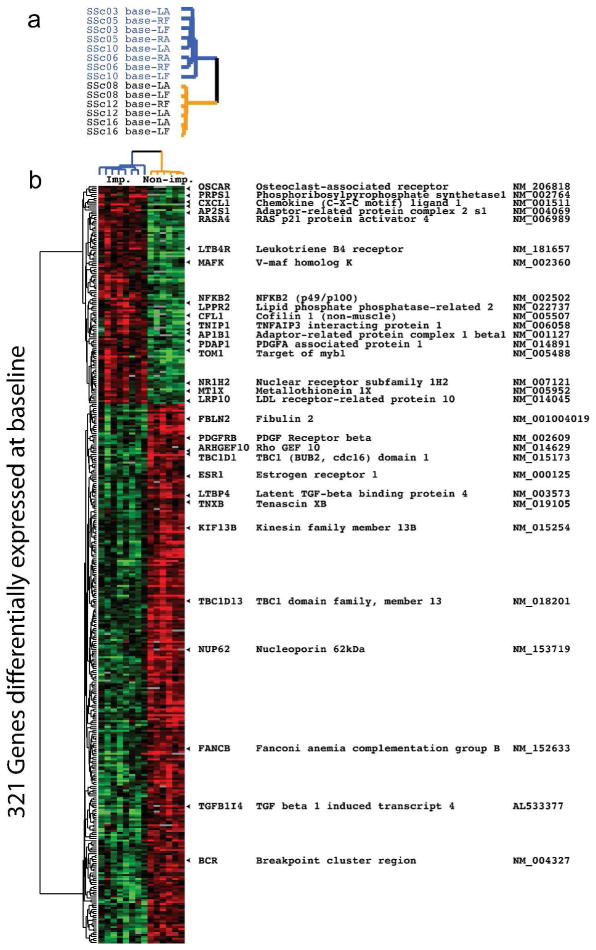
Figure 3. Comparison of baseline gene expression between improvers and non-improvers.
Baseline gene expression in arm and back samples between improvers (imp) and non-improvers (non-imp) was compared. a) Blue identifiers indicate improvers and gold indicates non-improvers. b) There were 321 genes identified (FDR<5%) with significant differential expression between improvers and non-improvers during MMF.

