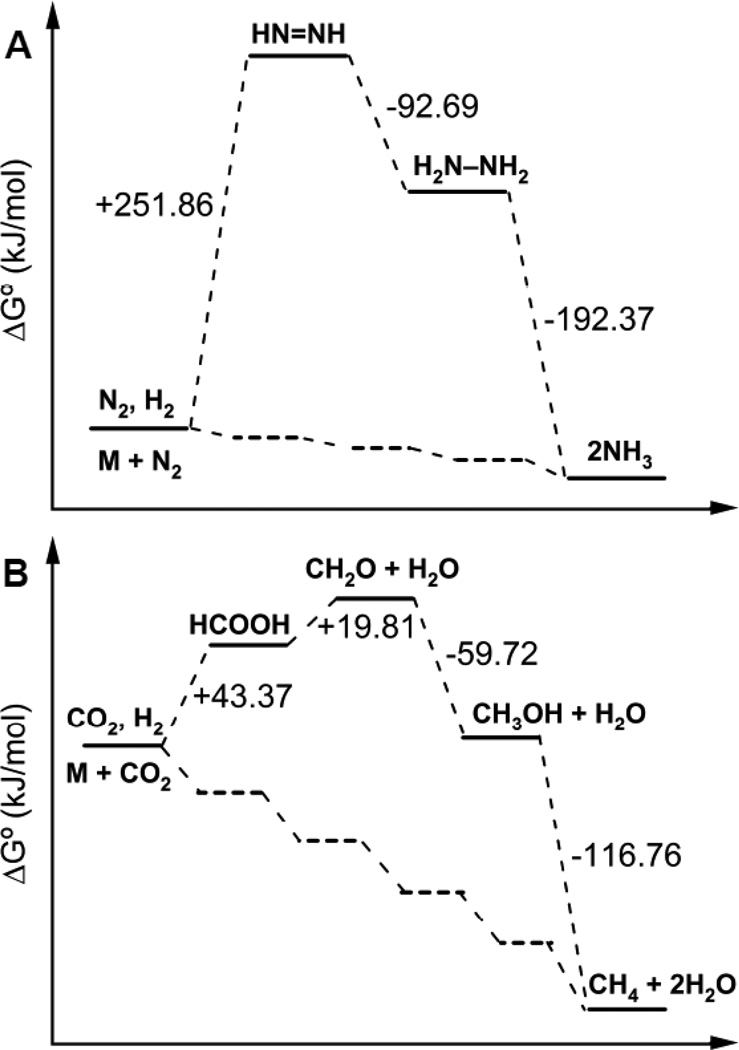
Figure 5.
Standard Gibb’s free energy change diagrams for N2 and CO2 reduction. Shown is the standard Gibb’s free energy change (ΔG°) between intermediates for the N2 (panel A) and CO2 (panel B) reduction pathways. Also shown are possible energy states for metal bound intermediates (lower dashed traces in both panels). All reaction standard Gibb’s free energy changes were calculated from known standard Gibb’s free energy of formation values [98–100].

