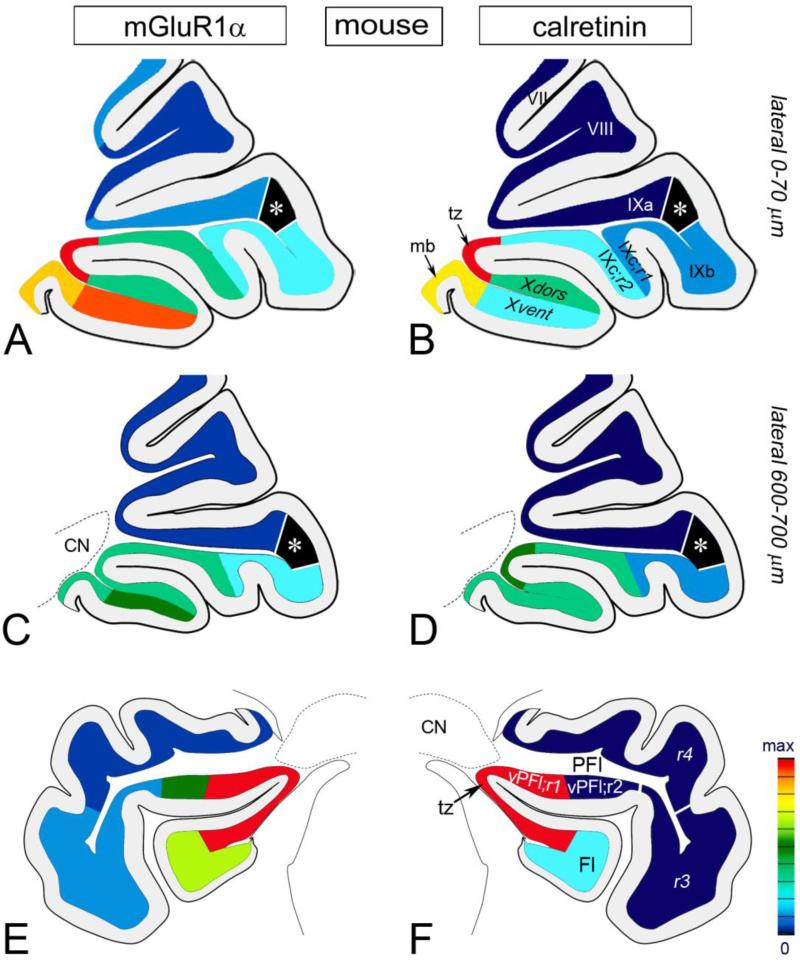
Fig. 10.
A gradient map of UBC subclass distribution in mouse cerebellum. The red colored areas represent regions with the highest density (max) of either mGluR1α+ UBCs (a, c, e) or CR+ UBCs (b, d, f). The deep blue colored area contain hardly any UBCs. a-d Nodulus, uvula and VIII in parasagittal plane. The highest UBC densities for mGluR1α and CR are detected in the midline sections (a, b). In the lateral sections (c, d) the UBC densities are decreased. The tz IX to X contain the highest density of both UBC subtypes (a, b). Differences in the distribution between the two UBC subclasses are apparent, especially in ventral leaflet of nodulus. In Xvent dense mGluR1α+ UBC population is contrasted with low density of CR+ UBCs. While every lobule contain mGluR1α+ UBCs (a, c), albeit with different density, the CR+ UBCs (b, d) are present mostly in nodulus and IXc;r2. Asterisk marks a distinct field of uvula (between IXa and IXb) that is devoid of mGluR1α+ UBCs and CR+ UBCs. e, f Fl and PFL in coronal plane. mGluR1α+ UBCs and CR+ UBCs are present in high density in the tz Fl to PFl that also includes vPFl;r1. Notably, mGluR1α+ UBC are widespread in PFl but not the CR+ UBCs (compare e to f). For numerical data of UBC densities see Supplementary Tables 2 and 3.

