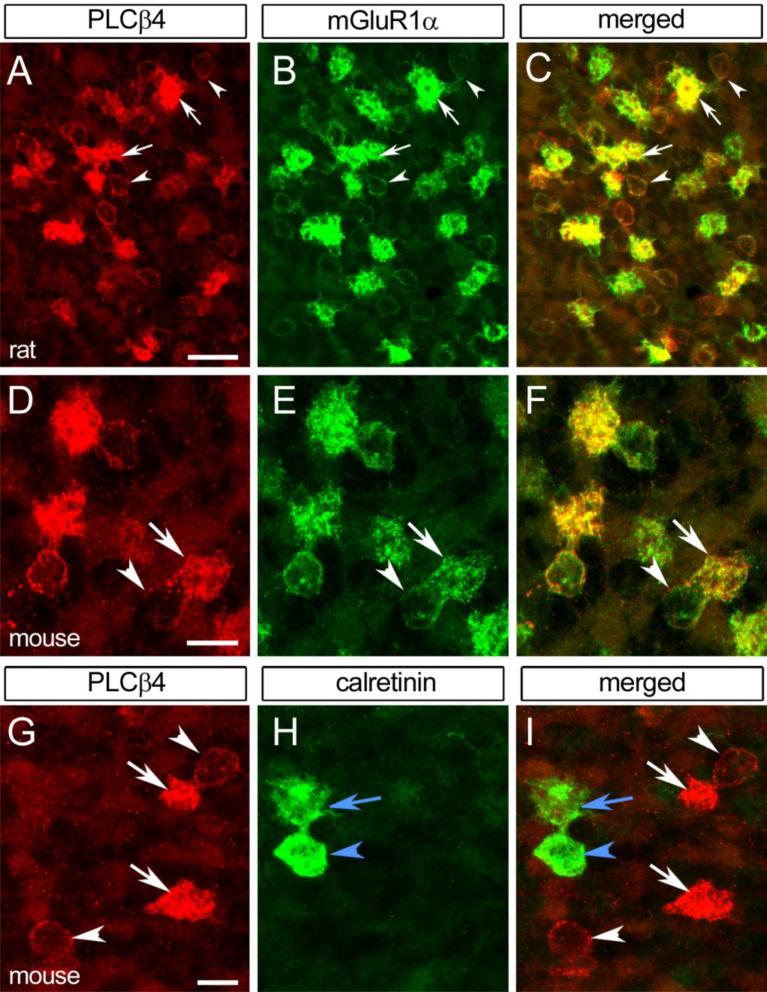
Fig. 12.
Confocal immunofluorescence images of rat (a-c) and mouse (d-i) cerebellar cryosections from nodulus double-labeled with antibodies to PLCβ4 and UBC subclass specific markers. In both species PLCβ4+ UBCs are mGluR1α+ (a-f) but CR- (g-i). White arrows and arrowheads indicate brushes and somata of PLCβ1+/mGluR1α+ UBCs (a-g, i). Blue arrows and arrowheads indicate brushes and somata of PLCβ1-/CR+ UBCs (h, i). Panels d-f are from Tg(Grp-EGFP)DV197Gsat mice; UBC somata show an enhanced signal due to the presence of EGF (e). Scale bars a 10 μm (applies to a-c), d 20 μm (applies to d-f), g 20 μm (applies to g-i)

